
Page 120 - The New Articulate Executive_ Look, Act and Sound Like a Leader
P. 120
THE POWERPOINT PARADOX 111
YEAR ENDED DECEMBER 31,
(IN THOUSANDS, EXCEPT PER SHARE DATA)
2010 2011 2012 2013 2014
Statement of operations data
New revenues
Widget $3,016 $5,834 $9,999 $12,720 $14,821
Knickknack 4 1,302 1,836 2,960 5,815
Other — 150 112 676 664
Total net revenues 3,020 7,286 11,947 16,356 20,800
Gross profit 1,734 4,664 7,864 10,288 1,351
Expenses
Selling 1,933 2,618 3,364 4,008 4,958
Marketing 151 87 246 1,035 1,433
Research and development 657 493 966 1,667 1,899
General and administrative 1,535 1,331 2,129 2,518 3,171
Total expenses 4,276 4,529 6,705 9,228 11,461
Income (loss) before
international operating expenses, net (2,542) 135 1,159 1,060 1,890
International operating expenses, net (1) — 181 460 464 943
Net interest income (expense) (114) 57 57 (12) 85
Provision for income taxes (2) — — 6 30 24
Net income (loss) $(2,656) $11 $750 $554 $1,008
Net income (loss) per share $(1.24) $— $.20 $.14 $.25
Weighted average shares outstanding 2,148 3,514 3,707 3,906 4,095
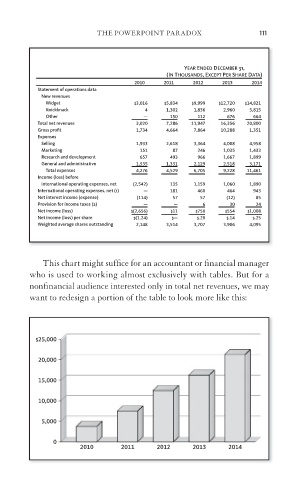
This chart might suffice for an accountant or fi nancial manager
who is used to working almost exclusively with tables. But for a
nonfinancial audience interested only in total net revenues, we may
want to redesign a portion of the table to look more like this:
$25,000
20,000
15,000
10,000
5,000
0
2010 2011 2012 2013 2014