
Page 110 - The Petroleum System From Source to Trap
P. 110
104 Peters and Cassa
OXYGEN 'i HYDROGEN ; ORGANIC WELL HYDROCARBON
INDEX I INDEX ; : DATA INDICATIONS
DEPTH I DEPTH
I I Oil ' II : GAS I
IIH
- · - H'IIIOCAIONS NIB
IOCIC-IVAL
(5,1 TOC)lOO IOCl-IVAL
S, ..... �
u 1.5 u t J J J
I ,I
I I
I I I I I
500
2000
lOOO
1000
1500
- � - � - - - - - -
2000
0
z
--- - - , - � -
'
25110
1 '
i :
, ,,
-
-�-�! - - - - - lOOO
3500
:i
'I
I
I I
, I
-: -� , - - - -
4500
5000
S, =HCS ALREADV IN ROCK S2 =HCS FROM KEROGEN PYROL VSIS. s, =C02 FROtA KEROGEN PVROL VSIS.
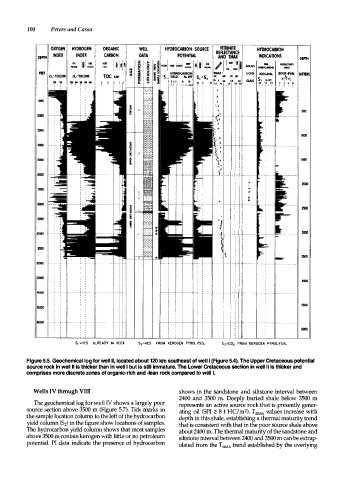
Figure 5.5. Geochemical log for well II, located about 120 km southeast of well I (Figure 5.4). The Upper Cretaceous potential
source rock In well II is thicker than in well I but is still immature. The Lower Cretaceous section in well Il ls thicker and
comprises more discrete zones of organic-rich and -lean rock compared to well I.
Wells IV through VIII shows in the sandstone and siltstone interval between
2400 and 3500 m. Deeply buried shale below 3500 m
The geochemical log for well IV shows a largely poor represents an active source rock that is presently gener
source section above 3500 m (Figure 5.7). Tick marks in ating oil (SPI 2: 8 t HC/m2). Trnax values increase with
the sample location column to the left of the hydrocarbon depth in this shale, establishing a thermal maturity trend
yield column (52) in the figure show locations of samples. that is consistent with that in the poor source shale above
The hydrocarbon yield column shows that most samples about 2400 m. The thermal maturity of the sandstone and
above 3500 m contain kerogen with little or no petroleum siltstone interval between 2400 and 3500 m can be extrap
potential. PI data indicate the presence of hydrocarbon olated from the I max trend established by the overlying