Page 113 - The Petroleum System From Source to Trap
P. 113

5.  Applied Source Rock Geochemistry   107

                                  II        I
                          HYDROGEN  ,   ORGANIC   WELL                                  HYDROCARBON
                            INDEX   11   CARBON   1  I   DATA                           INDICATIONS
               DErrH                                                                      ..,.   I
                          ""   Iii . ...   ::  � � 1�1�11                               HTDIOONS I
                          -   �  -                                                  MUD         .....
                                        I   �  II t;                                LOG   IOCI-IVAL   IOCIC-EVAL
               FEET
                          15,/ TOC)lOO
                                     TOC  liWT  j! <
                                                                                        S,  .. W1   �
                                                                                    GAS      I
                                                                                          IS  1.5
                                                                                                 I  I
                         •  •  •    ,.  1 00   4   I  J   2   I   II                    D.S  ,  : I   2  ·'  .I  J
                          I  I  �  :   '                                                           I
                                        i
                                          I  I
               1000
                      '
                      '
                      '
                      '                                                                               500
                      '
                               '
                      '      '  - , ---
                   -  �  '  ,- -T--
               zooo         - ,
                      1
                                                                                                      1000
                         _  _  _  _  _  '    1  _  '  l  _ _  _     -  -  -  -  -  -
               4000
                                                                                                       1500
               5000
               6000
                                                                                                       2000
               1000
               8000
                                                                                                       2500
               9000
               10000


                                                                                                       ]500
               11000

               llOOO
                                                                                                       4000
               14000
                                                                                                       4500
               15000

                    -� '  .  -  �  '  -  -
               16000     '   I  I
                    :   :    I  I                                                                      5000
                    '   '   I  I  I   I
                            51 =HCS   ALREADY  IN  ROCK   �2 =HCS   FRO�  KEROGEN  PYROLYSIS.   S3 =C02  FROM  KEROGEN  PYROLYSIS.

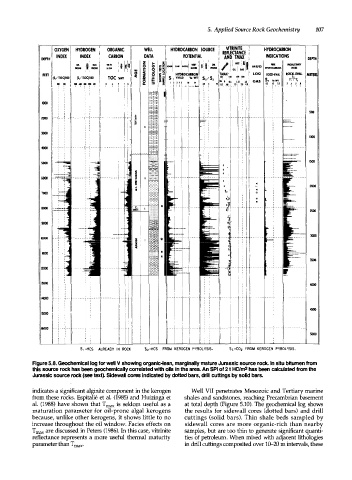
            Figure 5.8. Geochemical log for well V showing organic-lean, marginally mature Jurassic source rock. In situ bitumen from
            this source rock has been geochemically correlated with oils in the area. An SPI of 2 t HC/m2 has been calculated from the
            Jurassic source rock (see text� Sidewall cores indicated by dotted bars, drill cuttings by solid bars.

            indicates a significant alginite component in the kerogen   Well  VII  penetrates  Mesozoic  and  Tertiary marine
            from these  rocks.  Espitalie  et  at.  (1985)  and  Huizinga  et   shales and  sandstones,  reaching  Precambrian basement
            al.  (1988)  have  shown  that  T  max  is  seldom  useful  as  a   at  total  depth  (Figure 5.10). The  geochemical  log  shows
            maturation  parameter  for  oil-prone  algal  kerogens   the  results  for  sidewall  cores  (dotted  bars)  and  drill
            because, unlike other  kerogens,  it  shows  little to  no   cuttings  (solid  bars).  Thin  shale  beds  sampled  by
            increase throughout  the oil  window.  Facies effects  on   sidewall  cores  are  more  organic-rich  than  nearby
            T ma x  are discussed in  Peters  (1986). In this case, vitrinite   samples,  but  are  too thin  to  generate  significant quanti­
            reflectance represents  a  more  useful  thermal  maturity   ties  of petroleum. When mixed  with  adjacent  lithologies
                                                              in drill cuttings composited over 1(}-20 m intervals, these
            parameter than T  max·
   108   109   110   111   112   113   114   115   116   117   118