Page 114 - The Petroleum System From Source to Trap
P. 114

108     Peters and Cassa


                   OXYGEN                       WELL    HYDROCARBON  SOURCE            HYDROCARBON
                   INDEX  i                     DATA        POTENTIAL                   INDICATIONS
              DEPTH                                                                                  DEPTH
                                       I   '  I  I   2  g  dl,-1 FMI 1-1  WI!
                                               :a:
                        1 .. '!.  I , . :.  :;   ! I  !!!1�                              F&    PIIOIUYMn'
                    TOCI100 I  IS. I TOC)�   TOC  %WT  I  '   i � �   81  YIELD               ROCK-l:VAL
              FEET                                       I  IIYDROCA:..
                                                                                               .-!h  !
                                                                WT
                                                              %.
                   ...  m  I ,.. ..,  ..,  ,.. m   4   3   2  '   I   II � i  �   !I  .,   t     2  1  4  1   II  2G      s1  •. wr   .1  :z  .3 ....   1
                                               LL.
                                                                                        u  u  u
                                                  �
                    �   I   I   I   !   �   I   I   I   !   : � II  I  1  1  1 1 1 1 1 1  ..  , ,'   I  I  :  :    I   1   1   1  1  1  ,  '1
                                                               ,
                                         I  ��i==T �   I!  I
                                         �, ::�        I _                                            500
              1000                         -           i  I
              2000                                                                - - - - -- --- , - - - --- - - - - -- :
                                         I
              lOOO
                                                                                                      1000
              5000                                                                                    1500
                                                                                          '
                                                                                  - - - -
              6000                                                             - --     -  _L  _  _    _
                                                                               �
                                                                                -
                                                                                                      2000
              1000
              8000
                                                                                                      2500
              9000

                                                                                                      JOOO
              10000
              llOO
                                                                                                      J500


              0000
                                                                                                      4000
              14000
                    '   '
                    '                                                                                 4500
              15000   '
                                                                                          '
                                                                                          '  .
                              '  '
                              '                                                                       5000
                            '  '
                           S1  =HCS   ALREADY  IN  ROCK   S2 =HCS   FRO�  KEROGEN  PYROLYSIS.   SJ =C02  FROM  KEROGEN  PYROLYSIS.

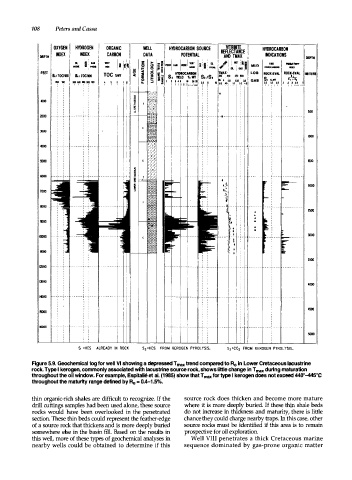
            Figure 5.9. Geochemical log for well VI showing a depressed T max trend compared to R0 in Lower Cretaceous lacustrine
           rock. Type I kerogen, commonly associated with lacustrine source rock, shows little change in T max during maturation
           throughout the oil window. For example, Espitalie et al. (1985) show that T  max for type I kerogen does not exceed 440°-445°C
            throughout the maturity range defined by R0 = 0.4-1.5%.


            thin organic-rich shales are  difficult  to recognize. If the   source  rock does  thicken  and  become more mature
            drill cuttings samples had been used alone, these source   where  it is more deeply buried.  If these thin shale beds
            rocks  would  have  been  overlooked  in  the  penetrated   do  not increase in thickness  and  maturity, there is little
            section. These thin beds could represent the feather-edge   chance they could charge nearby traps. In this case, other
            of a source rock that thickens and is more deeply buried   source rocks must be  identified  if this  area is  to  remain
            somewhere  else  in the basin fill.  Based  on the  results  in   prospective for oil exploration.
            this well, more of these types of geochemical analyses in   Well  VIII  penetrates a  thick Cretaceous marine
            nearby wells  could be  obtained  to  determine  if this   sequence dominated  by  gas-prone  organic  matter
   109   110   111   112   113   114   115   116   117   118   119