Page 116 - The Petroleum System From Source to Trap
P. 116

110     Peters and Cassa


                          HYDROGEN              WELL                                   HYDROCARBON
                   INDEX   INDEX                DATA                                    INDICATIONS
              DEPTH  .                                                                                DEPTH
                             '  '
                         ,.:.  : i : �  : i                                        MUD    fiEI  ij  IIODIClMI
                                                                                                INOD
                             I   I   I'                                                 "'�
                          15,1 TOC)IOO  ���                                         LOG   S ,  .. wr  I  �   I
               FEET                                                                     ROC�YAL ' IOCIC-fAL
                                                                                          1
                         . . . .  J                                                          !  '
                                                                                    GAS
                                                                                        ';1
                                                                                         1 i5 1 11J  I  ·�  ·�  ·�  ·�
               1000
                      '  - - - - , - � - �                                                            500
                   -;·- - r           - +  '
                                        I
                             I  :  �
              JOOO
                                                                                                      1000

                                                                                                      ISOO
                                                                               . . ,  '
                                                                                .,
                                                                                . '
                                                                         - - - -  - -  ._�_
                                                                               "
                                                                                •
                                                                                                      2000
                                                                            ')
                                                                            .·�
                                                                                                      2500


                                                                                                      lOCO


                                                                                                      3500


                                                                                                      4000


                                                                                                      4500


                                                                                                      5000
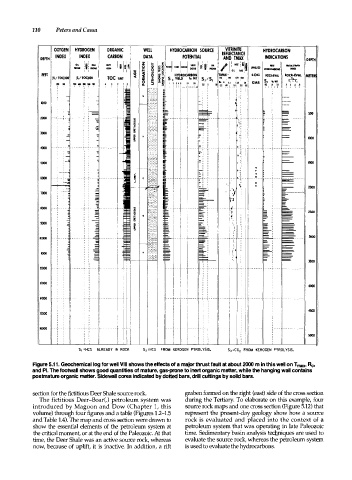
                           S, =HCS   ALREADY  IN  ROCK   S2 =HCS   FROM  KEROGEN  PYROLYSIS.   S3 =C02  FROM  KEROGEN  PYROLYSIS.

            Figure 5.1 1 .   Geochemical log for well VIII shows the effects of a major thrust fault at about 2000 m in this well on T  max•  R0,
            and Pl. The footwall shows good quantities of mature, gas-prone to inert organic matter, while the hanging wall contains
            post mature organic matter. Sidewall cores indicated by dotted bars, drill cuttings by solid bars.


            section for the fictitious Deer Shale source rock.   graben formed on the right (east) side of the cross section
              The fictitious  Deer-Boar(.) petroleum system was   during the Tertiary. To elaborate  on  this example,  four
            introduced by Magoon and  Dow  (Chapter  1 ,   this   source rock maps and one cross section (Figure 5.12) that
                                                    1
            volume) through four figures and a table (Figures  . 2-15   represent  the  present-day geology  show how a source
            and Table 1.4). The map and cross section were drawn to   rock is  evaluated  and  placed into the context  of  a
            show  the  essential elements  of  the  petroleum  system at   petroleum system that was operating in late Paleozoic
            the critical moment, or at the end of the Paleozoic. At that   time. Sedimentary basin analysis techniques are used to
            time, the Deer Shale was an active source rock, whereas   evaluate the source rock, whereas the petroleum system
            now, because of uplift,  it  is  inactive.  In addition,  a rift   is used to evaluate the hydrocarbons.
   111   112   113   114   115   116   117   118   119   120   121