
Page 119 - The Petroleum System From Source to Trap
P. 119
5. Applied Source Rock Geochemistry 113
times 100. The average HI values were determined in the
same way as the average TOC values, that is, over 20-m � � �
+
intervals. The average HI contours range from 400 to 583 / "
/ � �· �
mg HC/ g TOC, indicating type ll kerogen. li � � �
The source potential index requires Rock-Eval � � \
pyrolysis data as well as the thickness and density of the I � \
source rock unit, as discussed by Demaison and I <> \�
Huizinga (Chapter 4, this volume). If the density, net � ,� � \
thickness, and quality of a source rock remain constant, I � � � � � �
�
SPI decreases as thermal maturity increases. Because \ - - - - --- � I
these SPI values indicate remaining potential, they are '-- - � � ......_ I
called "residual SPI'' (Figure 5.12E). Residual SPI values "' - - � � / �
for the Deer Shale increase to the southwest (lower left), A � �
but are interpreted to be less than 4 where the source
rock is buried deepest. The source rock density is � No Shaws + Oft Show HYDROCARBON SHOWS
constant (Table 5.4). If prior to increased thermal (Po Gas Show e Oil Rec:over•d, DST OVERBURDEN ROCK INTERVAL
maturity, the SPI values all increased to the southwest
from 2 to 10, then along strike there is a decrease of up to
8 SPI units caused by thermal maturity. These are
moderate to high SPis (Figure 4.4).
These maps indicate that the Deer Shale is a very good
to excellent source rock that contains type ll kerogen and
that there is a pod of thermally mature source rock in the
west-central part of the map. Additional information,
such as paleontology, indicates that the Deer Shale was
deposited in a marine environment, and organic petrog
raphy indicates that the kerogen macerals are in part
waxy pollen (terrigenous), but mostly marine algal
debris.
The cross section that represents present-day geology
indicates that the overburden rock to the east in the rifted �
B
graben is Tertiary in age, whereas the overburden rock in
the foreland basin to the west is late Paleozoic (Figure HYDROCARBON SHOWS
5.12F). Because the source rock is absent from either side SEAL ROCK INTERVAL
of the graben, and the graben is filled with nonmarine
silidclastics, the conclusion is that the hydrocarbons mig
mated from the west side of the cross section from the
pod of mature source rock mapped earlier.
The maps and interpretations outlined here are part of
sedimentary basin analysis because organic and rock
matter are investigated. The thickness, TOC content, %
Ro, and SPI are all mappable properties of the source
rock However, the well control shown on the base map
indicates that hydrocarbons have been detected in the
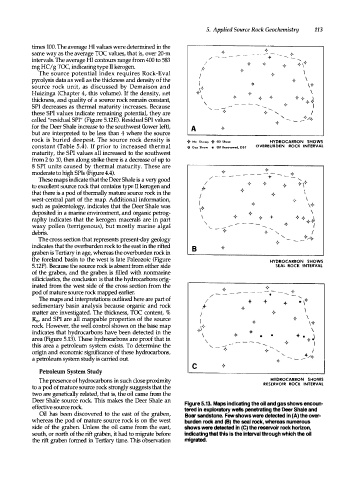
area (Figure 5.13). These hydrocarbons are proof that in
this area a petroleum system exists. To determine the
origin and economic significance of these hydrocarbons,
a petroleum system study is carried out.
c �
Petroleum System Study
HYDROCARBON SHOWS
The presence of hydrocarbons in such close proximity RESERVOIR ROCK INTERVAL
to a pod of mature source rock strongly suggests that the
two are genetically related, that is, the oil came from the
Deer Shale source rock. This makes the Deer Shale an Figure 5.13. Maps indicating the oil and gas shows encoun
effective source rock tered in exploratory wells penetrating the Deer Shale and
Oil has been discovered to the east of the graben, Boar sandstone. Few shows were detected in (A) the over
whereas the pod of mature source rock is on the west burden rock and (B) the seal rock, whereas numerous
side of the graben. Unless the oil came from the east, shows were detecte in (C) the reservoir rock horizon,
south, or north of the rift graben, it had to migrate before Indicating that this is the interval through which the oil
the rift graben formed in Tertiary time. This observation migrate.