
Page 115 - The Petroleum System From Source to Trap
P. 115
5. Applied Source Rock Geochemistry 109
VITRINITE
ORGANIC WELL : HYDROCARBON SOURCE REFLECTANCE HYDROCARBON
CARBON II DATA I POTENTIAL AND TMAX INDICATIONS
= z ,..
.. 0
)tl!l�ll � "
0
c ....
! � :1:
TOC %WT I
0 !::
... ....
000
i
5110
2000
3000
1000
�000
5000 15110
::::::::::::::: ... 1····
6000 ���m-+-- ---
. ' [ 2000
""'"']'"""""•
1000
.
8000 - - - � - - - - - - - - - ---11 2 5110
I
1 9000 '
3000 1
10000
1000
35110
12000
13000
'
14000 - - - , , -
'
'
�5110 '
15000
'
'
16000 -, - ' -
5000
S, =HCS ALREADY IN ROCK S2 =HCS FROM KEROGEN PYROLYSIS. S3 =C02 FROM KEROGEN PYROLYSIS.
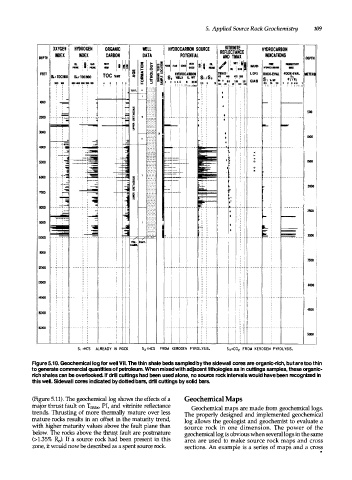
Figure 5.1 o. Geochemical log for well VII. The thin shale beds sampled by the sidewall cores are organic-rich, but are too thin
to generate commercial quantities of petroleum. When mixed with adjacent lithologies as in cuttings samples, these organic
rich shales can be overlooked. If drill cuttings had been used alone, no source rock intervals would have been recognized in
this well. Sidewall cores indicated by dotted bars, drill cuttings by solid bars.
(Figure 5.11). The geochemical log shows the effects of a Geochemical Maps
major thrust fault on Tmax, PI, and vitrinite reflectance Geochemical maps are made from geochemical logs.
trends. Thrusting of more thermally mature over less The properly designed and implemented geochemical
mature rocks results in an offset in the maturity trend, log allows the geologist and geochemist to evaluate a
with higher maturity values above the fault plane than source rock in one dimension. The power of the
below. The rocks above the thrlli!t fault are postmature geochemical log is obvious when several logs in the same
1
(> . 35% Ro). If a source rock had been present in this area are used to make source rock maps and cross
zone, it would now be described as a spent source rock. sections. An example is a series of maps and a cross
•