
Page 118 - The Petroleum System From Source to Trap
P. 118
112 Peters and Cassa
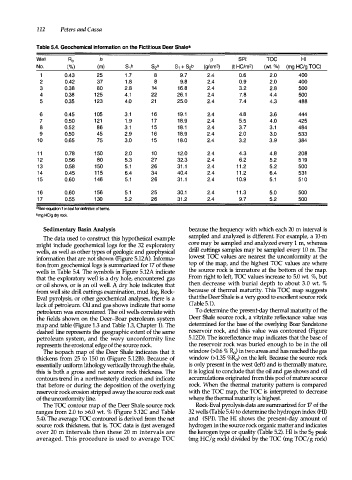
Table 5.4. Geochemical Information on the Fictitious Deer Shalea
Well Ro h p SPI TOC HI
No. (%) (m) S,b Szb 81 + S2b (glcm3) (t HC/m2) (wt. %) (mg HC/g TOC)
0.43 25 1 . 7 8 9.7 2 . 4 0.6 2.0 400
2 0.42 37 1 . 8 8 9.8 2.4 0.9 2.0 400
3 0.38 80 2.8 14 1 6 .8 2.4 3.2 2.8 500
4 0.38 1 2 5 4.1 22 26. 1 2.4 7.8 4.4 500
5 0.35 1 2 3 4.0 21 25.0 2.4 7.4 4.3 488
6 0.45 1 0 5 3.1 1 6 19.1 2.4 4.8 3.6 444
7 0.50 1 2 1 1 . 9 1 7 1 8 .9 2.4 5.5 4.0 425
8 0.52 86 3.1 1 5 1 8 . 1 2.4 3.7 3.1 484
9 0.50 45 2.9 1 6 1 8 .9 2.4 2.0 3.0 533
1 0 0.65 75 3.0 1 5 1 8 .0 2.4 3.2 3.9 384
1 1 0.78 1 5 0 2.0 1 0 1 2 .0 2.4 4.3 4.8 208
1 2 0.56 80 5.3 27 32.3 2.4 6.2 5.2 5 1 9
1 3 0.58 1 5 0 5.1 26 31 .1 2.4 1 1 . 2 5.2 500
1 4 0.45 1 1 5 6.4 34 40.4 2.4 1 1 . 2 6.4 531
1 5 0.60 1 4 6 5.1 26 31 .1 2.4 1 0 .9 5.1 51 0
1 6 0.60 1 5 6 5.1 25 30.1 2.4 1 1 . 3 5.0 500
1 7 0.55 1 3 0 5.2 26 31 .2 2.4 9.7 5.2 500
a5ee equation 1 in text for definition of terms.
bmg HCig dry rock.
Sedimentary Basin Analysis because the frequency with which each 20 m interval is
The data used to construct this hypothetical example sampled and analyzed is different. For example, a 10-m
might include geochemical logs for the 32 exploratory core may be sampled and analyzed every 1 m , whereas
wells, as well as other types of geologic and geophysical drill cuttings samples may be sampled every 10 m. The
information that are not shown (Figure 5.12A). Informa lowest TOC values are nearest the unconformity at the
tion from geochemical logs is summarized for 17 of these top of the map, and the highest TOC values are where
wells in Table 5.4. The symbols in Figure 5.12A indicate the source rock is immature at the bottom of the map.
that the exploratory well is a dry hole, encountered gas From right to left, TOC values increase to 5.0 wt. %, but
or oil shows, or is an oil well. A dry hole indicates that then decrease with burial depth to about 3.0 wt. %
from well site drill cuttings examination, mud log, Rock because of thermal maturity. This TOC map suggests
Eva! pyrolysis, or other geochemical analyses, there is a that the Deer Shale is a very good to excellent source rock
lack of petroleum. Oil and gas shows indicate that some (Table 5.1).
petroleum was encountered. The oil wells correlate with To determine the present-day thermal maturity of the
the fields shown on the Deer-Boar petroleum system Deer Shale source rock, a vitrinite reflectace value was
map and table (Figure . 3 and Table 1 . 3, Chapter 1). The determined for the base of the overlying Boar Sandstone
1
dashed line represents the geographic extent of the same reservoir rock, and this value was contoured (Figure
petroleum system, and the wavy unconformity line 5.120). The isoreflectance map indicates that the base of
represents the erosional edge of the source rock. the reservoir rock was buried enough to be in the oil
The isopach map of the Deer Shale indicates that it window (>0.6 % Ro) in two areas and has reached the gas
thickens from 25 to 150 m (Figure 5.12B). Because of window (> 1.35 %Ro) on the left. Because the source rock
essentially uniform lithology vertically through the shale, is only present in the west (left) and is thermally mature,
this is both a gross and net source rock thickness. The it is logical to conclude that the oil and gas shows and oil
contours trend in a northwesterly direction and indicate accumulations originated from this pod of mature source
that before or during the deposition of the overlying rock. When the thermal maturity pattern is compared
reservoir rock erosion stripped away the source rock east with the TOC map, the TOC is interpreted to decrease
of the unconformity line. where the thermal maturity is highest.
The TOC contour map of the Deer Shale source rock Rock-Eva! pyrolysis data are summaried for 17 of the
ranges from 2.0 to >6.0 wt. % (Figure 5.12C and Table 32 wells (Table 5.4) to determine the hydrogen index (HI)
5.4). The average TOC contoured is derived from the net and (SPI). The HI shows the present-day amount of
source rock thickness, that is, TCX:: data is first averaged hydrogen in the source rock organic matter and indicates
over 20 m intervals then these 20 m intervals are the kerogen type or quality (Table 5.2). HI is the � peak
averaged. This procedure is used to average TOC (mg HC/g rock) divided by the TOC: (mg TOC/g rock)