
Page 117 - The Petroleum System From Source to Trap
P. 117
5. Applied Source Rock Geochemistry 111
12 �
+ 9 ;\ �
I 0 \ 0
/t I S <> 10
I ' '
I ' '
I ' ' '
' '
' o a \-<>- , <>
'
: <> 16 ' \0
'
17�\ + 7 ' '
'
' � 11 + 0 '
' <>-- •: c• a ? ·\
I D :
'
I I
'¢ 13 I I
_tA _ _ ot-·%
� 14
A B
INDEX MAP
FOI WELL � Dry Holo + ISOPACH MAP
NUMIUS ON Oil Sh- SOURCE ROCK
TABLE 4 (> Gas Sh- 0 Oil Woll
C. I. • 50 MIETIIS
�'\*
'
'
'
'
'
\-<>-
'
'
' ,
+ 0
? •\
I
I
' I
_ + _.;
TOTAL ORGANIC CARBON CONTENT %R 0 BASE RESERVOIR ROCK
C. I. = 1.0 WT% TOC C.l. • 0.1 "' 0.6
C.l. • D.• abcwe 0.6
� AVERAGE TOC FOI TOTAL THICKNESS
0.75
1--- GEOGRAPHIC EXTENT OF PETROLEUM SYSTEM - --1
'
'
� '
0 \ -<{-
\�
+- • \
0 0 � •i
� 0 : D Overburden Rock
0 I
' D Seal Rock
O_t-�� - Petroleum accumulation
-- ••• Top of oil window L c'.:l Rosei'Yoir Rock
0
<;>11.2 •.. BoHom of oil window 0 Source Rock
E F
RESIDUAL SPI MAP PRESENT DAY
C.l,z2 TONS HC/M 2
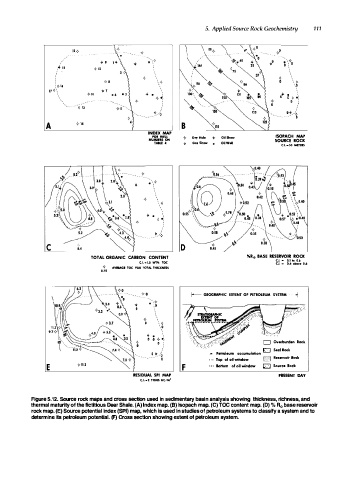
Figure 5.12. Source rock maps and cross section used in sedimentary basin analysis showing thickness, richness, and
thermal maturity of the fictitious Deer Shale. (A) Index map. (B) Isopach map. (C) TOC content map. (D) % R0 base reservoir
rock map. (E) Source potential index (SPI) map, which is used in studies of petroleum systems to classify a system and to
determine its petroleum potential. (F) Cross section showing extent of petroleum system.