
Page 159 -
P. 159
The Practical Pumping Handbook .....................................................................
8.2.5.1 Example 1 - Approximate Selection
Select a pump for 600 gpm of 5% A.D. kraft stock at 100 feet total head.
Enter the correction chart for chemical stock (Figure 8.11) at
o
100% capacity and read upward to the desired percent stock (5%)
and find the water rating correction factor (Kp = 0.87).
Divide the stock head and capacity by the correction factor to
,
find approximate water rating.
600
Qw = = 690 gpm
0.87
100
Hw = = 115 ft Total Head
0.87
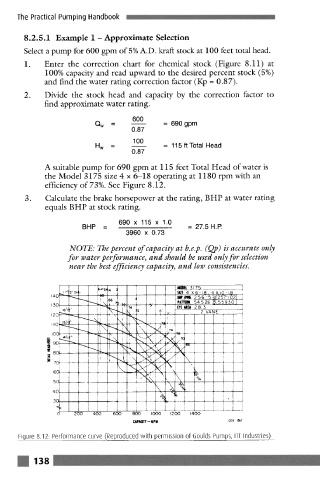
A suitable pump for 690 gpm at 115 feet Total Head of water is
the Model 3175 size 4 x 6-18 operating at 1180 rpm with an
efficiency of 73%. See Figure 8.12.
Calculate the brake horsepower at the rating, B HP at water rating
,
equals B HP at stock rating.
690 x 115 x 1.0
BHP = = 27.5 H.P.
3960 x 0.73
NOTE: The percent of capacity at b.e.p. (Qp) is accurate only
for water performance, and should be used only for selection
near the best efficiency capacity, and low consistencies.
1401 17 2"Oil 9 ~- i " SiZE 4 X 6 -18 . 4 X I0 -18
D I,, 1 I .. i --PAffBIN 54 5 26 ~ 5.5930 I
:5 : t'i - E
.2o--'--~., '.. ~ ,, ,"'; ......
II
i
I00 . . . . . .
90 ','-.
.., 80
,,G
o
'- 70
50 [ ~. ""
! r , "' \ ,,'o',, T t
3o
0 200 400 600 800 I000 1200 1400
~PkOTT-- 6PM cDs 1~7
Figure 8.12: Performance curve (Reproduced with permission of Goulds Pumps, ITT Industries)
! 138