
Page 234 - The Six Sigma Project Planner
P. 234
0.75 + 1.00 + 0.25
= 0.67
3
• Reproducibility is the average of the reproducibility scores for the two days
combined (see Table 20), i.e.,
( 1 +0 + 1 + 0 + 1 +0 + 0 + 1 ) = 0.50
4 4
2
• Accuracy is the average of the accuracy scores for the two days combined (see
Table 20), i.e.,
( 1 +0 + 0 + 0 + 1 +0 + 0 + 0 ) = 0.25
4 4
2
• Bias is the estimated proportion in a category divided by the true proportion in
the category. In this example, the true percent defective is 50% (1 part in 2). Of
the 24 evaluations, 12 evaluations classified the item as defective. Thus, the bias
is 0.5 – 0.5 = 0.
Overall Stability
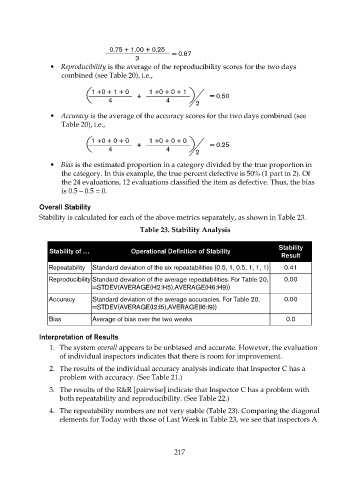
Stability is calculated for each of the above metrics separately, as shown in Table 23.
Table 23. Stability Analysis
Stability
Stability of … Operational Definition of Stability
Result
Repeatability Standard deviation of the six repeatabilities (0.5, 1, 0.5, 1, 1, 1) 0.41
Reproducibility Standard deviation of the average repeatabilities. For Table 20, 0.00
=STDEV(AVERAGE(H2:H5),AVERAGE(H6:H9))
Accuracy Standard deviation of the average accuracies. For Table 20, 0.00
=STDEV(AVERAGE(I2:I5),AVERAGE(I6:I9))
Bias Average of bias over the two weeks 0.0
Interpretation of Results
1. The system overall appears to be unbiased and accurate. However, the evaluation
of individual inspectors indicates that there is room for improvement.
2. The results of the individual accuracy analysis indicate that Inspector C has a
problem with accuracy. (See Table 21.)
3. The results of the R&R [pairwise] indicate that Inspector C has a problem with
both repeatability and reproducibility. (See Table 22.)
4. The repeatability numbers are not very stable (Table 23). Comparing the diagonal
elements for Today with those of Last Week in Table 23, we see that inspectors A
217