
Page 238 - The Six Sigma Project Planner
P. 238
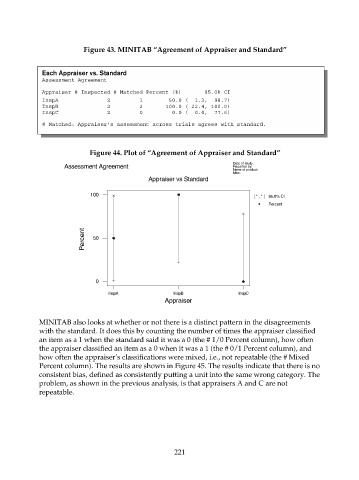
Figure 43. MINITAB “Agreement of Appraiser and Standard”


                     Each Appraiser vs. Standard
                     Assessment Agreement

                     Appraiser # Inspected # Matched Percent (%)       95.0% CI
                     InspA               2         1        50.0 (  1.3,  98.7)
                     InspB               2         2       100.0 ( 22.4, 100.0)
                     InspC               2         0         0.0 (  0.0,  77.6)

                     # Matched: Appraiser’s assessment across trials agrees with standard.


                                   Figure 44. Plot of “Agreement of Appraiser and Standard”
                                                                              Date of study:
                            Assessment Agreement                              Reported by:
                                                                              Name of product:
                                                                              Misc:
                                                     Appraiser vs Standard
                                   100
                                                                                     [ , ] 95.0% CI
                                                                                         Percent


                                 Percent  50


                                     0
                                         InspA              InspB               InspC
                                                          Appraiser


                    MINITAB also looks at whether or not there is a distinct pattern in the disagreements
                    with the standard. It does this by counting the number of times the appraiser classified
                    an item as a 1 when the standard said it was a 0 (the # 1/0 Percent column), how often
                    the appraiser classified an item as a 0 when it was a 1 (the # 0/1 Percent column), and
                    how often the appraiser’s classifications were mixed, i.e., not repeatable (the # Mixed
                    Percent column). The results are shown in Figure 45. The results indicate that there is no
                    consistent bias, defined as consistently putting a unit into the same wrong category. The
                    problem, as shown in the previous analysis, is that appraisers A and C are not
                    repeatable.


                                                             221