
Page 239 - The Six Sigma Project Planner
P. 239
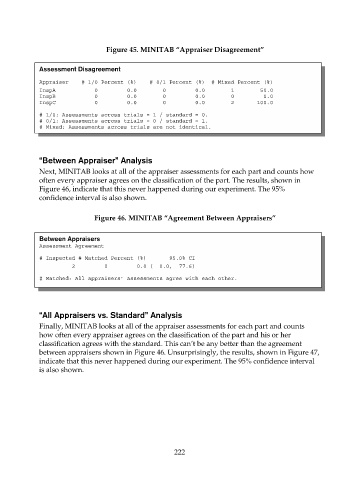
Figure 45. MINITAB “Appraiser Disagreement”

                    Assessment Disagreement

                    Appraiser    # 1/0 Percent (%)    # 0/1 Percent (%)  # Mixed Percent (%)
                    InspA            0         0.0        0         0.0        1        50.0
                    InspB            0         0.0        0         0.0        0         0.0
                    InspC            0         0.0        0         0.0        2       100.0

                    # 1/0: Assessments across trials = 1 / standard = 0.
                    # 0/1: Assessments across trials = 0 / standard = 1.
                    # Mixed: Assessments across trials are not identical.


                    “Between Appraiser” Analysis
                    Next, MINITAB looks at all of the appraiser assessments for each part and counts how
                    often every appraiser agrees on the classification of the part. The results, shown in
                    Figure 46, indicate that this never happened during our experiment. The 95%
                    confidence interval is also shown.

                                     Figure 46. MINITAB “Agreement Between Appraisers”


                    Between Appraisers
                    Assessment Agreement

                    # Inspected # Matched Percent (%)       95.0% CI
                              2         0         0.0 (  0.0,  77.6)

                    # Matched: All appraisers’ assessments agree with each other.


                    “All Appraisers vs. Standard” Analysis
                    Finally, MINITAB looks at all of the appraiser assessments for each part and counts
                    how often every appraiser agrees on the classification of the part and his or her
                    classification agrees with the standard. This can’t be any better than the agreement
                    between appraisers shown in Figure 46. Unsurprisingly, the results, shown in Figure 47,
                    indicate that this never happened during our experiment. The 95% confidence interval
                    is also shown.


                                                             222