
Page 242 - The Six Sigma Project Planner
P. 242
is really going on. The effect of declining RTYs grows exponentially as more process
steps are involved.
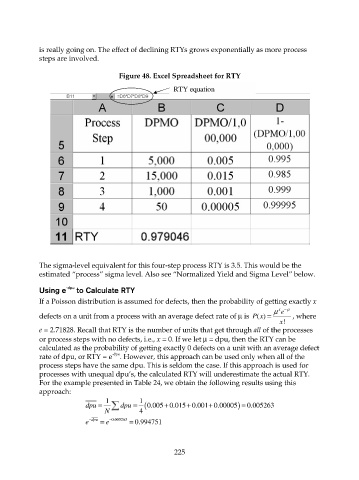
Figure 48. Excel Spreadsheet for RTY
RTY equation
The sigma-level equivalent for this four-step process RTY is 3.5. This would be the
estimated “process” sigma level. Also see “Normalized Yield and Sigma Level” below.
Using e -dpu to Calculate RTY
If a Poisson distribution is assumed for defects, then the probability of getting exactly x
µ x − µ
e
defects on a unit from a process with an average defect rate of µ is () = , where
Px
! x
e = 2.71828. Recall that RTY is the number of units that get through all of the processes
or process steps with no defects, i.e., x = 0. If we let µ = dpu, then the RTY can be
calculated as the probability of getting exactly 0 defects on a unit with an average defect
-dpu
rate of dpu, or RTY = e . However, this approach can be used only when all of the
process steps have the same dpu. This is seldom the case. If this approach is used for
processes with unequal dpu’s, the calculated RTY will underestimate the actual RTY.
For the example presented in Table 24, we obtain the following results using this
approach:
+
+
dpu = 1 dpu = 1 (0.005 0.015 0.001 0.00005 =
+
) 0.005263
N ∑ 4
− dpu − 0.005263
e = e = 0.994751
225