
Page 247 - The Six Sigma Project Planner
P. 247
Analytic Hierarchy Process (AHP) Using MS Excel
The analytic hierarchy process (AHP) is a powerful technique for decision-making. It is
also quite elaborate and if you wish to obtain exact results you will probably want to
use specialized software, such as Expert Choice 2000 (www.expertchoice.com).
However, if all you need is a good approximation and if you are willing to forgo some
of the bells and whistles, you can use a spreadsheet to perform the analysis. To
demonstrate this, we will use Microsoft Excel to repeat the analysis we performed in
Chapter 3.
Example
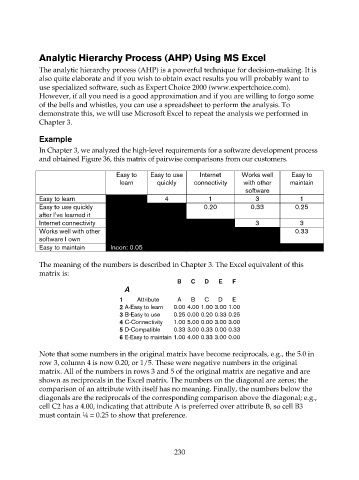
In Chapter 3, we analyzed the high-level requirements for a software development process
and obtained Figure 36, this matrix of pairwise comparisons from our customers.
Easy to Easy to use Internet Works well Easy to
learn quickly connectivity with other maintain
software
Easy to learn 4 1 3 1
Easy to use quickly 0.20 0.33 0.25
after I’ve learned it
Internet connectivity 3 3
Works well with other 0.33
software I own
Easy to maintain Incon: 0.05
The meaning of the numbers is described in Chapter 3. The Excel equivalent of this
matrix is:
B C D E F
A
1 Attribute A B C D E
2 A-Easy to learn 0.00 4.00 1.00 3.00 1.00
3 B-Easy to use 0.25 0.00 0.20 0.33 0.25
4 C-Connectivity 1.00 5.00 0.00 3.00 3.00
5 D-Compatible 0.33 3.00 0.33 0.00 0.33
6 E-Easy to maintain 1.00 4.00 0.33 3.00 0.00
Note that some numbers in the original matrix have become reciprocals, e.g., the 5.0 in
row 3, column 4 is now 0.20, or 1/5. These were negative numbers in the original
matrix. All of the numbers in rows 3 and 5 of the original matrix are negative and are
shown as reciprocals in the Excel matrix. The numbers on the diagonal are zeros; the
comparison of an attribute with itself has no meaning. Finally, the numbers below the
diagonals are the reciprocals of the corresponding comparison above the diagonal; e.g.,
cell C2 has a 4.00, indicating that attribute A is preferred over attribute B, so cell B3
must contain ¼ = 0.25 to show that preference.
230