
Page 245 - The Six Sigma Project Planner
P. 245
yield or of how the organization’s products will perform in the field. To calculate these,
refer to the equation above, at the start of this section.
Solving for a Desired RTY
Assuming every step has an equal yield, it is possible to “backsolve” to find the
normalized yield required in order to get a desired RTY for the entire process. (See
Equation 6.)
1
n
Y = RTY = RTY n
n (Equation 6)
where Yn is the yield for an individual process step and N is the total number of steps.
If the process yields are not equal, then Yn is the required yield of the worst step in the
process. For example, for a 10-step process with a desired RTY of 0.999, the worst
1 1
acceptable yield for any process step is Y = RTY 10 = (0.999 ) = 0.9999.
10
n
Finding RTY Using Simulation
Unfortunately, finding the RTY isn’t always as straightforward as described above. In
the real world, you seldom find a series of process steps all neatly feeding into one
another in a nice, linear fashion. Instead, you have different supplier streams, each with
different volumes and different yields. There are steps that are sometimes taken and
sometimes not. There are test and inspection stations, with imperfect results. There is
rework and repair. The list goes on and on. In such cases, it is sometimes possible to
trace a particular batch of inputs through the process, monitoring the results after each
step. However, it is often exceedingly difficult to control the workflow in the real world.
The production and information systems are not designed to provide the kind of
tracking needed to get accurate results. The usual outcome of such attempts is
questionable data and disappointment.
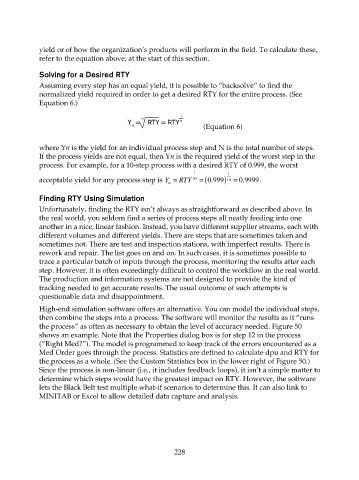
High-end simulation software offers an alternative. You can model the individual steps,
then combine the steps into a process. The software will monitor the results as it “runs
the process” as often as necessary to obtain the level of accuracy needed. Figure 50
shows an example. Note that the Properties dialog box is for step 12 in the process
(“Right Med?”). The model is programmed to keep track of the errors encountered as a
Med Order goes through the process. Statistics are defined to calculate dpu and RTY for
the process as a whole. (See the Custom Statistics box in the lower right of Figure 50.)
Since the process is non-linear (i.e., it includes feedback loops), it isn’t a simple matter to
determine which steps would have the greatest impact on RTY. However, the software
lets the Black Belt test multiple what-if scenarios to determine this. It can also link to
MINITAB or Excel to allow detailed data capture and analysis.
228