
Page 74 - The Six Sigma Project Planner
P. 74
Duration Estimates
Activity Depends (b) Weighted 18 19
(a) (c) 17 Variance Sigma
On Most Average
Optimistic Pessimistic
Likely
A 1 2 3 2.00 0.11 0.33
B A 3 5 9 5.33 1.00 1.00
C B 2 8 14 8.00 4.00 2.00
D C 1 6 13 6.33 4.00 2.00
E B 1 3 7 3.33 1.00 1.00
F E 3 4 8 4.50 0.69 0.83
G D, F 2 6 11 6.17 2.25 1.50
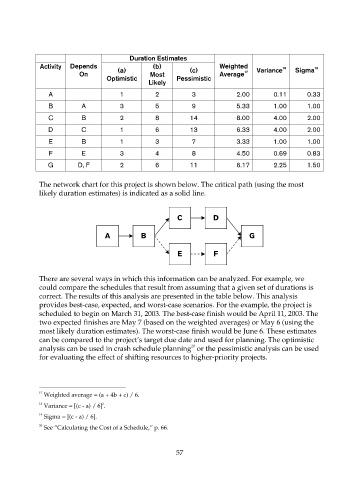
The network chart for this project is shown below. The critical path (using the most
likely duration estimates) is indicated as a solid line.
C D
A B G
E F
There are several ways in which this information can be analyzed. For example, we
could compare the schedules that result from assuming that a given set of durations is
correct. The results of this analysis are presented in the table below. This analysis
provides best-case, expected, and worst-case scenarios. For the example, the project is
scheduled to begin on March 31, 2003. The best-case finish would be April 11, 2003. The
two expected finishes are May 7 (based on the weighted averages) or May 6 (using the
most likely duration estimates). The worst-case finish would be June 6. These estimates
can be compared to the project’s target due date and used for planning. The optimistic
20
analysis can be used in crash schedule planning or the pessimistic analysis can be used
for evaluating the effect of shifting resources to higher-priority projects.
17
Weighted average = (a + 4b + c) / 6.
18 2
Variance = [(c - a) / 6] .
19
Sigma = [(c - a) / 6].
20
See “Calculating the Cost of a Schedule,” p. 66.
57