
Page 77 - The Six Sigma Project Planner
P. 77
Estimating Project Duration Statistically
While useful, the above analysis is missing some important information, namely
probabilities associated with each schedule. We know for example that the best- and
worst-case scenarios are combinations of improbable events and are therefore extremely
unlikely. These estimates provide useful bounds for our schedule estimates and are
helpful in determining whether or not the deadline is even realistic, but it would be
even better if we established a statistical distribution of schedule completion dates. We
will do so now.
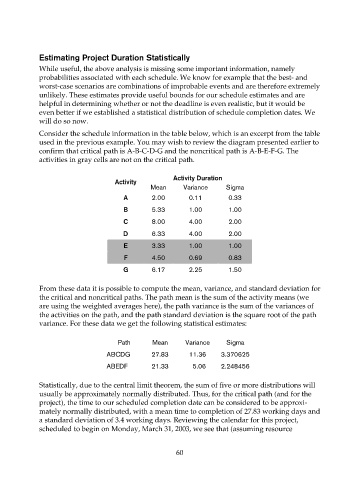
Consider the schedule information in the table below, which is an excerpt from the table
used in the previous example. You may wish to review the diagram presented earlier to
confirm that critical path is A-B-C-D-G and the noncritical path is A-B-E-F-G. The
activities in gray cells are not on the critical path.
Activity Duration
Activity
Mean Variance Sigma
A 2.00 0.11 0.33
B 5.33 1.00 1.00
C 8.00 4.00 2.00
D 6.33 4.00 2.00
E 3.33 1.00 1.00
F 4.50 0.69 0.83
G 6.17 2.25 1.50
From these data it is possible to compute the mean, variance, and standard deviation for
the critical and noncritical paths. The path mean is the sum of the activity means (we
are using the weighted averages here), the path variance is the sum of the variances of
the activities on the path, and the path standard deviation is the square root of the path
variance. For these data we get the following statistical estimates:
Path Mean Variance Sigma
ABCDG 27.83 11.36 3.370625
ABEDF 21.33 5.06 2.248456
Statistically, due to the central limit theorem, the sum of five or more distributions will
usually be approximately normally distributed. Thus, for the critical path (and for the
project), the time to our scheduled completion date can be considered to be approxi-
mately normally distributed, with a mean time to completion of 27.83 working days and
a standard deviation of 3.4 working days. Reviewing the calendar for this project,
scheduled to begin on Monday, March 31, 2003, we see that (assuming resource
60