
Page 80 - The Six Sigma Project Planner
P. 80
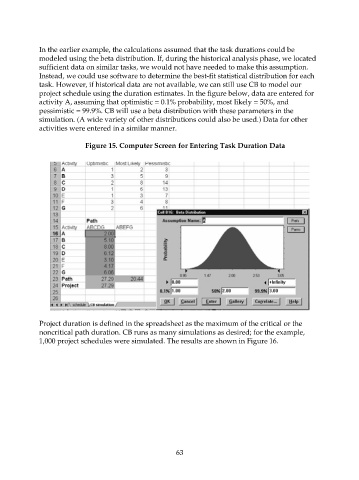
In the earlier example, the calculations assumed that the task durations could be
                    modeled using the beta distribution. If, during the historical analysis phase, we located
                    sufficient data on similar tasks, we would not have needed to make this assumption.
                    Instead, we could use software to determine the best-fit statistical distribution for each
                    task. However, if historical data are not available, we can still use CB to model our
                    project schedule using the duration estimates. In the figure below, data are entered for
                    activity A, assuming that optimistic = 0.1% probability, most likely = 50%, and
                    pessimistic = 99.9%. CB will use a beta distribution with these parameters in the
                    simulation. (A wide variety of other distributions could also be used.) Data for other
                    activities were entered in a similar manner.

                                  Figure 15. Computer Screen for Entering Task Duration Data


                    Project duration is defined in the spreadsheet as the maximum of the critical or the
                    noncritical path duration. CB runs as many simulations as desired; for the example,
                    1,000 project schedules were simulated. The results are shown in Figure 16.


                                                             63