
Page 82 - The Six Sigma Project Planner
P. 82
Discussion of Results
As expected, the distribution of project completion times appears to be approximately
normal. The mean and range of results are also quite close to what we obtained from
the statistical estimates. However, the simulation allows us to quickly explore a variety
of questions. For example, the second chart in Figure 16 shows us that the critical path is
not always the critical path! This chart is a histogram of the difference between the
critical path and the so-called noncritical path. It can be seen that about 1.5% of the time
the difference is negative, indicating that the noncritical path took longer to complete
than the critical path. This has obvious project management implications, such as not to
ignore tasks that are not on the critical path.
The ease of asking such what-if questions is a major benefit of simulation software. In
addition, many people (even some project sponsors!) are unfamiliar with statistics:
assumptions, such as the approximate normality of project durations, make them
uneasy. For these people, simulation can serve as a valuable confirmation of these
assumptions. The truth is, more than a few statisticians breathe a sigh of relief when
simulation results match analytical predictions.
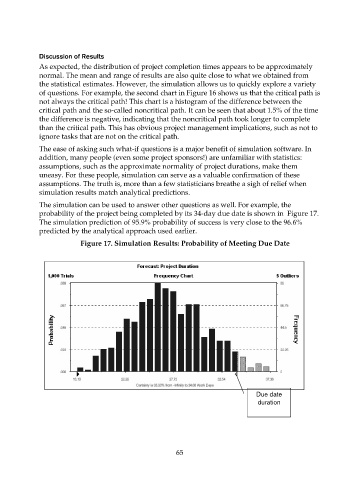
The simulation can be used to answer other questions as well. For example, the
probability of the project being completed by its 34-day due date is shown in Figure 17.
The simulation prediction of 95.9% probability of success is very close to the 96.6%
predicted by the analytical approach used earlier.
Figure 17. Simulation Results: Probability of Meeting Due Date
Due date
duration
65