
Page 160 - The Toyota Way Fieldbook
P. 160
Chapter 6. Establish Standardized Processes and Procedures 137
So how do we determine the demand and takt time? Select a demand num-
ber that will be sufficiently high enough to meet the need most of the time. For
example, suppose the demand varies from 10,000 to 20,000 per month but the
average is 16,000 per month. Which number should you choose? It depends on
the situation, but generally we advise a higher number. Here’s why. Let’s suppose
we use the maximum: 20,000. If we calculate a takt time, we will get a lower num-
ber (less time allotted per piece). We compare the takt time to the cycle time to
determine the discrepancy. Selecting a higher demand number will create a larger
discrepancy. The relevance of the discrepancy is only related to the amount of
improvement necessary to achieve the takt rate, and the improvement potential
is based on the waste that exists in the operation.
When presented with this dilemma, a Toyota sensei would respond, “No
problem,” meaning that the pool of waste is large and the needed improvement
can assuredly be made. The only risk of setting a demand level too large is that
the amount of effort needed to achieve the takt time will be greater. You do not
want to waste effort by falsely inflating the demand number (driving takt down),
but it is not a major problem. If a process is improved beyond the actual need,
the resources can be reduced or additional sales can be pursued.
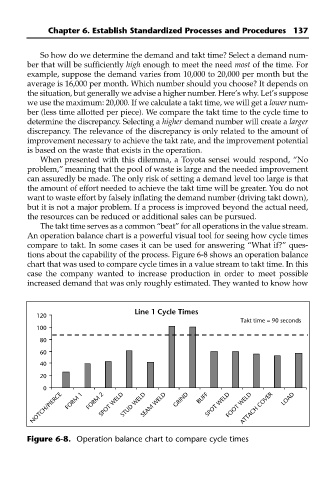
The takt time serves as a common “beat” for all operations in the value stream.
An operation balance chart is a powerful visual tool for seeing how cycle times
compare to takt. In some cases it can be used for answering “What if?” ques-
tions about the capability of the process. Figure 6-8 shows an operation balance
chart that was used to compare cycle times in a value stream to takt time. In this
case the company wanted to increase production in order to meet possible
increased demand that was only roughly estimated. They wanted to know how
Line 1 Cycle Times
120
Takt time = 90 seconds
100
80
60
40
20
0 BUFF
ATTACH COVER
NOTCH/PIERCE FORM 1 FORM 2 SPOT WELD STUD WELD SEAM WELD GRIND SPOT WELD FOOT WELD LOAD
Figure 6-8. Operation balance chart to compare cycle times