
Page 428 - The Toyota Way Fieldbook
P. 428
Chapter 19. Lean Implementation Strategies and Tactics 401
project approach.” It was kaizen upon kaizen relentlessly. Flow was
created but mostly locally within cells. There were a few kanban sys-
tems that had been set up prior to this radical year, but the main
focus of Digirolamo was on stability and cells. There was a clear bias
for action, radical changes were made fast, skeptics were convinced in
the plant and in other Tenneco plants, and the results were obvious.
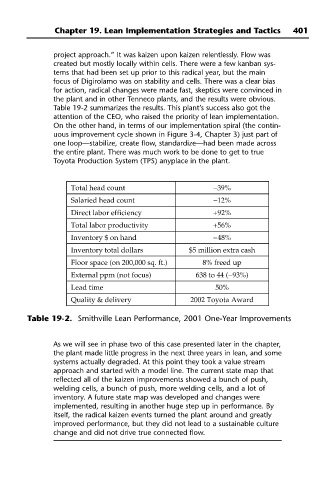
Table 19-2 summarizes the results. This plant’s success also got the
attention of the CEO, who raised the priority of lean implementation.
On the other hand, in terms of our implementation spiral (the contin-
uous improvement cycle shown in Figure 3-4, Chapter 3) just part of
one loop—stabilize, create flow, standardize—had been made across
the entire plant. There was much work to be done to get to true
Toyota Production System (TPS) anyplace in the plant.
Total head count −39%
Salaried head count −12%
Direct labor efficiency +92%
Total labor productivity +56%
Inventory $ on hand −48%
Inventory total dollars $5 million extra cash
Floor space (on 200,000 sq. ft.) 8% freed up
External ppm (not focus) 638 to 44 (−93%)
Lead time 50%
Quality & delivery 2002 Toyota Award
Table 19-2. Smithville Lean Performance, 2001 One-Year Improvements
As we will see in phase two of this case presented later in the chapter,
the plant made little progress in the next three years in lean, and some
systems actually degraded. At this point they took a value stream
approach and started with a model line. The current state map that
reflected all of the kaizen improvements showed a bunch of push,
welding cells, a bunch of push, more welding cells, and a lot of
inventory. A future state map was developed and changes were
implemented, resulting in another huge step up in performance. By
itself, the radical kaizen events turned the plant around and greatly
improved performance, but they did not lead to a sustainable culture
change and did not drive true connected flow.