
Page 106 - Theory and Design of Air Cushion Craft
P. 106
90 Steady drag forces
RJW= C (3.5)
VsPc
where RJ W is the wave-making drag-lift ratio, W the weight of craft and C w the
wave-making drag coefficient.
From this equation we can see that for constant cushion length / c, cushion beam B c
and craft weight W, the non-dimensional cushion pressure-length ratio p c, will stay
constant, but <p s will change with respect to different shape of cushion plan.
For a rectangular air cushion, p s = 1 and will be the minimum, meanwhile C w will
be minimum when the cushion plan is rectangular; therefore an air cushion with rec-
tangular shape will gain more advantage not only on the ratio between wave-making
drag and craft weight but also on take-off ability through hump speed.
Selection of the plan shape for an ACV should consider take-off ability, together
with seaworthiness and general arrangement of craft, as well as the configuration and
fabrication of skirts, etc., not just for minimum drag.
The study mentioned above was based upon the assumption of uniform distribution
of air pressure within the cushion and with a discontinuous sudden change of pressure
at the cushion edges. The sudden change of pressure distribution can only appear at
the sidewalls of an SES, and cannot exist on an ACV with flexible skirts. Therefore
this method will make a calculation error for an ACV.
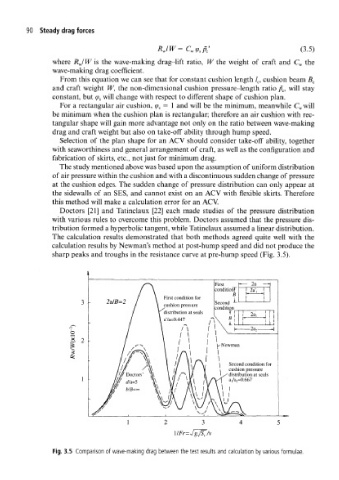
Doctors [21] and Tatinclaux [22] each made studies of the pressure distribution
with various rules to overcome this problem. Doctors assumed that the pressure dis-
tribution formed a hyperbolic tangent, while Tatinclaux assumed a linear distribution.
The calculation results demonstrated that both methods agreed quite well with the
calculation results by Newman's method at post-hump speed and did not produce the
sharp peaks and troughs in the resistance curve at pre-hump speed (Fig. 3.5).
First - — 2a —
condition^ { 2a , 1
B H
First condition for I i 1
2a/5=2 Second •"-
cushion pressure
condition
distribution at seals T f
a7a=0.447
r
o
E 2
1
QS
Second condition for
cushion pressure
distribution at seals
a,/a,=0.667
Fig. 3.5 Comparison of wave-making drag between the test results and calculation by various formulae.