
Page 117 - Thomson, William Tyrrell-Theory of Vibration with Applications-Taylor _ Francis (2010)
P. 117
104 Transient Vibration Chap. 4
Engineers have found the concept of the shock response spectrum to be
useful in design. The shock response spectrum (SRS) is a plot of the maximum peak
response of the single-DOF oscillator as a function of the natural period of the
oscillator. The maximum of the peaks, often labeled maximax, represents only a
single point on the time response curve. It does not uniquely define the shock
input because it is possible for two different shock pulses to have the same
maximum peak response. In spite of this limitation, the SRS is a useful concept
that is extensively used, especially for preliminary design.
In Eq. (4.2-1), the response of a system to arbitrary excitation fit) was
expressed in terms of the impulse response hit). For the undamped single-DOF
oscillator, we have
h(t) ^ sm (x)J
mo)„
so that the peak response to be used in the response spectrum plot is given by the
equation
1
•«(O m ax = moj - i ' f i O sin «„(i - (4.5-1)
n •'()
In the case where the shock is due to the sudden motion of the support point, fit)
is replaced by —yit), the acceleration of the support point, as in Eq. (4.2-5).
- 1
^ ( 0 max i y(^) sin (o^it - O (4.5-2)
•'n
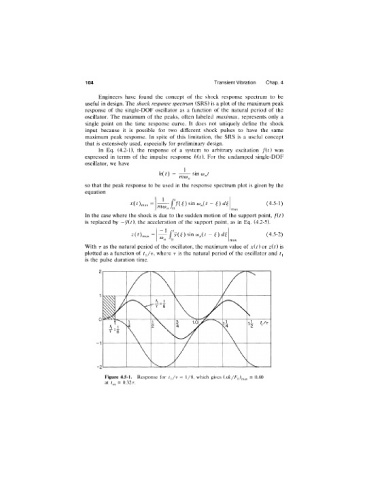
With T as the natural period of the oscillator, the maximum value of xit) or zit) is
plotted as a function of t^/r, where r is the natural period of the oscillator and t^
is the pulse duration time.
Figure 4.5-1. Response for t^/r = 1/8, which gives ixk/Ffi^.^,^ = 0.80
at t^ = 0 . 3 2 t .