
Page 118 - Thomson, William Tyrrell-Theory of Vibration with Applications-Taylor _ Francis (2010)
P. 118
Sec. 4.5 Shock Response Spectrum 105
To graphically describe the concept of the SRS, we choose the time response
to the rectangular pulse previously given in Sec. 4.4. For t > /„ the response is
given by Eq. 4.4-6, which clearly represents two step functions started at times
t 0 and t = These are plotted in Fig. 4.5-1 for t^/r = Their difference,
=
which is the response of the oscillator for r > /,, is shown by the dark line and the
peak response is = 0.80 at time = 0.32r. Thus, we have one point,
0.80, on the SRS plot of U/c/Tolmax vs. t^/r.
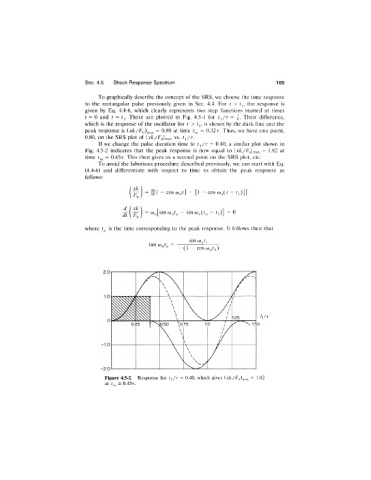
If we ehange the pulse duration time to t,/r = 0.40, a similar plot shown in
Fig. 4.5-2 indicates that the peak response is now equal to Ix / : | max = 1-82 at
time = 0.45r. This then gives us a second point on the SRS plot, etc.
To avoid the laborious procedure described previously, we can start with Eq.
(4.4-6) and differentiate with respect to time to obtain the peak response as
follows:
xk
= {[1 - cos W,,/] - [1 - cos - i|)]}
where t is the time corresponding to the peak response. It follows then that
sm o)„t
-(1 - cos
/ i / t
Figure 4.5-2. Response for t^/r = 0.40, which gives (xk/F^^)^.^^ = 1.82
at = 0.45r.