
Page 119 - Thomson, William Tyrrell-Theory of Vibration with Applications-Taylor _ Francis (2010)
P. 119
Transient Vibration Chap. 4
106
Figure 4.5-3.
which is shown in Fig. 4.5-3. Prora this figure, two other relations are found:
sin coj^
sin (x)„t„ = .
\/2(l - cos w„i,)
- ( l- c o s w „ f |) 1 ^ ----------------- -
cos —---------------— — COSiO^/|)
y2(l - cos v2
By substituting these results into the equation for (x/c/F q), the equation for the
peak response becomes
xk
p I = - coso)„i,)
0 / max
Vt,
= 2 siin = 2 sin t > (4.5-3)
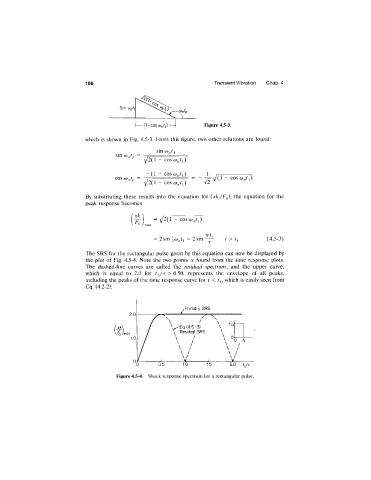
The SRS for the rectangular pulse given by this equation can now be displayed by
the plot of Fig. 4.5-4. Note the bvo points x found from the time response plots.
The dashed-line curves are called the residual spectrum, and the upper curve,
which is equal to 2.0 for t^/r > 0.50, represents the envelope of all peaks,
including the peaks of the time response curve iox t < which is easily seen from
Eq. (4.2-2).