
Page 134 - Thermodynamics of Biochemical Reactions
P. 134
7.4 Experimental Determination of Seven Apparent Equilibrium Constants 131
I . 1 1 1 1 1 1 . I I . I I I I [heme]
500 1000 1500 2000
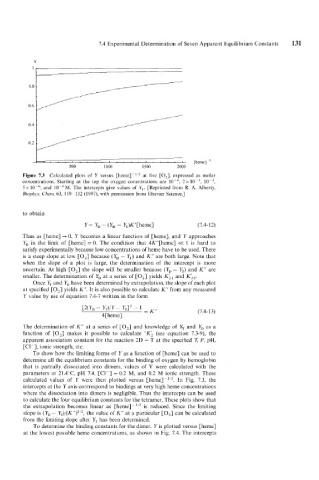
Figure 7.3 Calculated plots of Y versus [hemel-' at five [O,], expressed as molar
concentrations. Starting at the top the oxygen conentrations are 2 x lo-', lo-',
5 x and 10-'M. The intercepts give values of Y,. [Reprinted from R. A. Alberty,
Biophys. Chem. 63, 119 132 (1997), with permission from Elsevier Science.]
to obtain
Y = Y, - (Y, - Y,)K"[heme] (7.4- 1 2)
Thus as [heme] + 0, Y becomes a linear function of [heme], and Y approaches
Y, in the limit of [heme] = 0. The condition that 4K"[heme] << 1 is hard to
satisfy experimentally because low concentrations of heme have to be used. There
is a steep slope at low [O,] because (Y, - Y,) and K" are both large. Note that
when the slope of a plot is large, the determination of the intercept is more
uncertain. At high [O,] the slope will be smaller because (YD - Y,) and K" are
smaller. The determination of YD at a series of [O,] yields K;, and K;,.
Once YT and Y, have been determined by extrapolation, the slope of each plot
at specified [O,] yields K". It is also possible to Calculate K" from any measured
Y value by use of equation 7.4-7 written in the form
[2(YD - Y,)/Y- YT]2 - 1 = K" (7.4- 1 3)
4[heme]
The determination of K" at a series of [O,] and knowledge of YT and YD as a
function of [O,] makes it possible to calculate OK; (see equation 7.3-9), the
apparent association constant for the reaction 2D = T at the specified 7; P, pH,
[Cl-1, ionic strength, etc.
To show how thc limiting forms of Y as a function of [heme] can be used to
determine all the equilibrium constants for the binding of oxygen by hemoglobin
that is partially dissociated into dimers, values of Y were calculated with the
parameters at 21.4'C, pH 7.4, [Cl-] = 0.2 M, and 0.2 M ionic strength. These
calculated values of Y were then plotted versus [heme]-''2. In Fig. 7.3, the
intercepts at the Y axis corrrespond to bindings at very high heme concentrations
where the dissociation into dimers is negligible. Thus the intercepts can be used
to calculate the four equilibrium constants for the tetramer. These plots show that
the extrapolation becomes linear as [heme] '/, is reduced. Since the limiting
slope is (Y, - Y,)/(K ")1'2, the value of K" at a particular [O,] can be calculated
from the limiting slope after YT has been determined.
To determine the binding constants for the dimer, Y is plotted versus [heme]
at the lowest possible heme concentrations, as shown in Fig. 7.4. The intercepts