
Page 341 - Thermodynamics of Biochemical Reactions
P. 341
Thermodynamics of Binding of Ligands by Proteins 341
kD1=3.253*10A6;
kD2=8.155*10A5;
Plot [ yD, { 02,0,5 * 10 A - 6}, PlotRange- > { 0 , 1 } , AxesLabel- > { 'I \ ! \ ( O\-2 \ ) 1 'I, 'I \ ! \ (Y \-D\ ) 'I 1 1 ;
.-------
0.8-
[02 1
1x10⁻⁶ 2x10⁻⁶ 5~10-~
6 12 2
1 + 3.253 10 02 + 2.65282 10 02
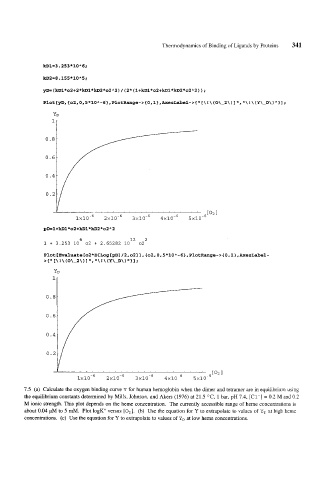
7.5 (a) Calculate the oxygen binding curve Y for human hemoglobin when the dimer and tetramer are in equilibrium using
the equilibrium constants determined by Mills, Johnson, and Akers (1976) at 21.5 OC, 1 bar, pH 7.4, [Cl-I = 0.2 M and 0.2
M ionic strength. This plot depends on the heme concentration. The currently accessible range of heme concentrations is
about 0.04 pM to 5 mM. Plot logK" versus [O,]. (b) Use the equation for Y to extrapolate to values of Y, at high heme
concentrations. (c) Use the equation for Y to extrapolate to values of YD at low heme concentrations.