
Page 501 - Bird R.B. Transport phenomena
P. 501
Problems 481
A very tiny chromatographic column is contained within a coil, which is in turn inserted
into a pipe through which a gas is blown to control the temperature (see Fig. 15B.7a). The gas
temperature will be called T g{t). The temperature at the ends of the coil (outside the pipe) is
T o, which is not very much different from the initial value of T g. The actual temperature
within the chromatographic column (i.e., within the coil) will be called TO). Initially the gas
and the coil are both at the temperature T ?o. Then beginning at time t = 0, the gas temperature
is increased linearly according to the equation
+ 7-) (15B.7-1)
hi
where t 0 is a known constant with dimensions of time.
You are told that, by inserting thermocouples into the column itself, the people in the lab
have obtained temperature curves that look like those in Fig. 15B.7(b). The T(£) curve seems to
become parallel to the T<,(f) curves for large t. You are asked to explain the above pair of
curves by means of some kind of theory. Specifically you are asked to find out the following:
(a) At any time t, what will T g - T be?
(b) What will the limiting value of T g - T be when t —» °°? Call this quantity (AT) X.
(c) What time interval ^ is required for T g - T to come within, say, 1% of (AT) a?
(d) What assumptions had to be made to model the system?
(e) What physical constants, physical properties, and so on, have to be known in order to
make a comparison between the measured and theoretical values of (AT)^?
Devise the simplest possible theory to account for the temperature curves and to answer
the above five questions.
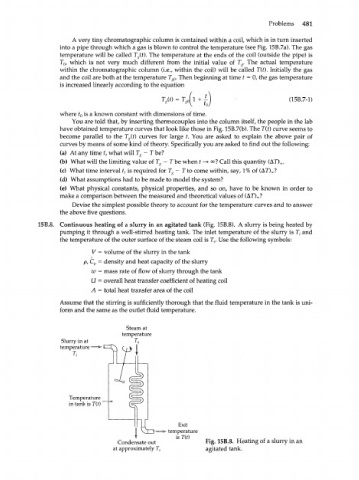
156.8. Continuous heating of a slurry in an agitated tank (Fig. 15B.8). A slurry is being heated by
pumping it through a well-stirred heating tank. The inlet temperature of the slurry is Г,- and
the temperature of the outer surface of the steam coil is T . Use the following symbols:
s
V = volume of the slurry in the tank
p, C = density and heat capacity of the slurry
p
w = mass rate of flow of slurry through the tank
U = overall heat transfer coefficient of heating coil
Л = total heat transfer area of the coil
Assume that the stirring is sufficiently thorough that the fluid temperature in the tank is uni-
form and the same as the outlet fluid temperature.
Steam at
temperature
Slurry in at
temperature -
Temperature
in tank is TO)
Exit
- temperature
is TO)
Condensate out Fig. 15B.8. Heating of a slurry in an
at approximately T s agitated tank.