Page 541 - Bird R.B. Transport phenomena
P. 541
§17.2  Temperature and Pressure Dependence of  Diffusivities  521

      §17.2  TEMPERATURE AND        PRESSURE
             DEPENDENCE      OF DIFFUSIVITIES
                           In this section we  discuss  the prediction  of  the diffusivity  2)  for  binary  systems by  cor-
                                                                              л в
                           responding-states  methods.  These  methods  are  also  useful  for  extrapolating  existing
                           data. Comparisons  of many alternative methods are available  in the literature. 12
                               For binary  gas  mixtures  at low  pressure, ЯЬ  is inversely proportional to the pressure,
                                                                   АВ
                           increases with  increasing  temperature, and is almost independent of the composition for a
                           given gas  pair. The following equation for  estimating ЯЬ  at low  pressures  has been  devel-
                                                                         АВ
                               3
                           oped  from  a combination of kinetic theory and corresponding-states  arguments:
                                                                  I
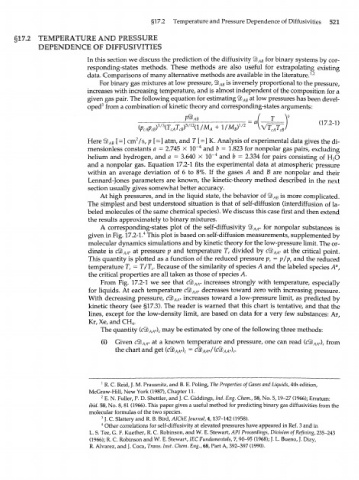
                                          рР                    + /M )  1 / 2
                                                                      B
                                         2
                           Here ЯЬ  [=] cm /s, p [=] atm, and  T [=]  K. Analysis  of  experimental data gives the di-
                                  АВ
                                                            4
                           mensionless  constants a  =  2.745  X  1СГ  and  b  =  1.823  for  nonpolar gas  pairs,  excluding
                                                                 4
                           helium  and  hydrogen,  and  a  =  3.640  X  1СГ  and  b  =  2.334  for  pairs  consisting  of  H O
                                                                                                   2
                           and  a nonpolar gas.  Equation  17.2-1  fits  the experimental  data  at  atmospheric  pressure
                           within  an  average  deviation  of  6  to  8%.  If  the  gases  A  and  В  are  nonpolar  and  their
                           Lennard-Jones  parameters  are  known,  the kinetic-theory  method  described  in  the  next
                           section usually  gives somewhat  better accuracy.
                               At  high  pressures,  and  in the liquid  state, the behavior  of 2)  лв  is  more complicated.
                           The simplest  and best  understood  situation  is  that  of  self-diffusion  (interdiffusion  of  la-
                           beled  molecules  of the same chemical species). We  discuss  this case first and then extend
                           the results  approximately  to binary  mixtures.
                               A  corresponding-states  plot  of  the  self-diffusivity  % *  for  nonpolar  substances  is
                                                                            AA
                                            4
                           given in Fig. 17.2-1.  This plot is based  on self-diffusion  measurements, supplemented  by
                           molecular dynamics simulations and by  kinetic theory for  the low-pressure  limit. The or-
                           dinate  is  сЯЬ *  at pressure  p  and  temperature  T, divided  by  c% *  at  the  critical  point.
                                       АА                                          AA
                           This quantity  is plotted as  a function  of  the reduced pressure  p y  = p/p c  and  the reduced
                           temperature  T  = T/T .  Because  of  the similarity  of  species  A  and the labeled  species  A*,
                                       r      c
                           the critical properties are all taken as those  of species  A.
                               From  Fig.  17.2-1  we  see  that  сЯЬ *  increases  strongly  with  temperature,  especially
                                                           АА
                           for  liquids.  At  each temperature сЯЬ *  decreases  toward  zero with  increasing  pressure.
                                                           АА
                           With  decreasing  pressure,  с2)дл* increases  toward  a low-pressure  limit, as  predicted  by
                           kinetic  theory  (see  §17.3).  The reader  is  warned  that this  chart is  tentative, and  that the
                           lines,  except  for  the low-density  limit, are based  on data  for  a very  few  substances:  Ar,
                           Kr, Xe, and CH .
                                        4
                               The quantity  {c% *)  may be estimated by one of the following three methods:
                                                c
                                             AA
                               (!)  Given  сЯЬ *  at  a known  temperature and  pressure,  one can read  (с2) *),. from
                                            АА                                                Л/4
                                   the chart and get  {(fdb *) c  =  с^ А
                                                      AA
                               1
                                R. C. Reid, J. M. Prausnitz, and  В. Е. Poling, The Properties of Gases and Liquids, 4th edition,
                           McGraw-Hill, New York  (1987), Chapter 11.
                               2
                                E. N. Fuller, P. D. Shettler, and J. С  Giddings, Ind. Eng. Chem., 58, No. 5,19-27  (1966); Erratum:
                            ibid. 58, No. 8,81  (1966). This paper gives a useful  method  for predicting binary gas  diffusivities  from the
                           molecular formulas of the two species.
                                J. С  Slattery and  R. B. Bird, AIChE Journal  4,137-142 (1958).
                               3
                                Other correlations for  self-diffusivity  at elevated pressures have appeared in Ref. 3 and in
                               4
                            L. S. Tee, G. F. Kuether,  R. C. Robinson, and W.  E. Stewart, API Proceedings, Division  of Refining, 235-243
                            (1966); R. C. Robinson and W.  E. Stewart, 1EC Fundamentals, 7, 90-95 (1968); J. L. Bueno, J. Dizy,
                            R. Alvarez, and J. Coca, Trans. Inst.  Chem. Eng., 68, Part A, 392-397 (1990).

