
Page 40 - Tribology in Machine Design
P. 40
Basic principles of tribology 27
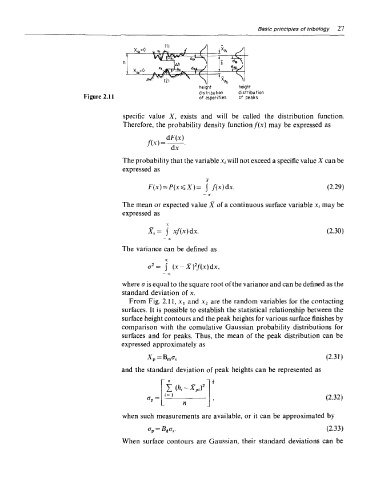
Figure 2.11
specific value X, exists and will be called the distribution function.
Therefore, the probability density function/(x) may be expressed as
The probability that the variable x, will not exceed a specific value X can be
expressed as
The mean or expected value X of a continuous surface variable x, may be
expressed as
The variance can be defined as
where <r is equal to the square root of the variance and can be defined as the
standard deviation of x.
From Fig. 2.11, Xj and x 2 are the random variables for the contacting
surfaces. It is possible to establish the statistical relationship between the
surface height contours and the peak heights for various surface finishes by
comparison with the comulative Gaussian probability distributions for
surfaces and for peaks. Thus, the mean of the peak distribution can be
expressed approximately as
and the standard deviation of peak heights can be represented as
when such measurements are available, or it can be approximated by
When surface contours are Gaussian, their standard deviations can be