
Page 313 - Tunable Lasers Handbook
P. 313
6 Transition Metal Solid-state Lasers 273
Flashlamp radiation has been shown to induce both transient and stable losses
in GSGG and GSAG. Losses have been measured as a function of wavelength,
flashlamp energy, and time [50,51]. Some of the losses induced by the flashlamp
will disappear spontaneously as a function of time. whereas others remain for long
periods of time. In general, the Aashlamp-induced loss is more severe in GSGG
than in GSAG. Higher losses are associated with the higher volatility of Ga,O, in
the laser material growth process when compared with A1-0,. Higher volatiiti of
the former has been shown to result in 0 vacancies in the laser material. Vacancies
can contribute to color center formation. which could explain the losses. In general
flashlamp-induced losses are more severe at shorter wavelengths than they are at
longer wavelengths. For example, stable flashlamp-induced loss was low at the las-
ing wavelength and progressively became worse as short wa\ elengths were
approached. Although Aashlamp-induced loss increased as the flashlamp energ)
increased, considerable saturation in this effect has been noted. especially at the
shorter wavelengths where the problem is more severe. Flashlamp-induced losses
tend to decrease as a fimction of the time interval between the flashlamp pulse and
the measurement. No single exponential decay constant could be associated with
the process. possibly indicating the formation of several types of loss mechanisms.
.:!
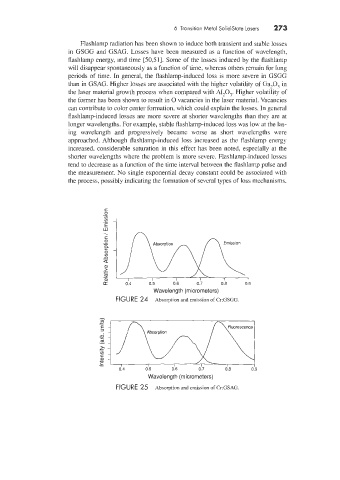
Wavelength (micrometers)
FIGURE 24 Absorption and emission of Cr:GSGG
- Absorption Fluorescence
x
._
v) C
a,
c
-
c
0.4 0.5 0.6 0.7 0.8 0.9
Wavelength (micrometers)
FIGURE 25 Absorption and emission of Cr:GSAG.