
Page 115 - Urban Construction Project Management
P. 115
74 Chapter Five
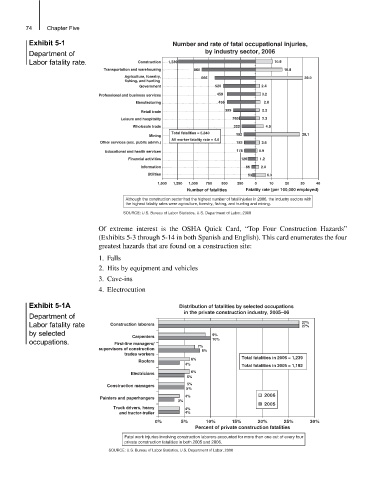
Exhibit 5-1 Number and rate of fatal occupational injuries,
Department of by industry sector, 2006
Labor fatality rate. Construction 1,239 10.9
Transportation and warehousing 860 16.8
Agriculture, forestry, 655 30.0
fishing, and hunting
Government 520 2.4
Professional and business services 459 3.2
Manufacturing 456 2.8
Retail trade 359 2.2
Leisure and hospitality 265 2.3
Wholesale trade 222 4.9
Total fatalities = 5,840
Mining 192 28.1
All worker fatality rate = 4.0
Other services (exc. public admin.) 183 2.6
Educational and health services 178 0.9
Financial activities 126 1.2
Information 66 2.0
Utilities 53 6.3
1,500 1,250 1,000 750 500 250 0 10 20 30 40
Number of fatalities Fatality rate (per 100,000 employed)
Although the construction sector had the highest number of fatal injuries in 2006, the industry sectors with
the highest fatality rates were agriculture, forestry, fishing, and hunting and mining.
SOURCE: U.S. Bureau of Labor Statistics, U.S. Department of Labor, 2008
Of extreme interest is the OSHA Quick Card, “Top Four Construction Hazards”
(Exhibits 5-3 through 5-14 in both Spanish and English). This card enumerates the four
greatest hazards that are found on a construction site:
1. Falls
2. Hits by equipment and vehicles
3. Cave-ins
4. Electrocution
Exhibit 5-1A Distribution of fatalities by selected occupations
in the private construction industry, 2005–06
Department of
Labor fatality rate Construction laborers 27%
27%
by selected 9%
Carpenters
occupations. First-line managers/ 10%
supervisors of construction 7%
8%
trades workers
Roofers 6% Total fatalities in 2006 = 1,239
4% Total fatalities in 2005 = 1,192
6%
Electricians
5%
5%
Construction managers
5%
4% 2006
Painters and paperhangers
3%
2005
Truck drivers, heavy 4%
and tractor-trailer 4%
0% 5% 10% 15% 20% 25% 30%
Percent of private construction fatalities
Fatal work injuries involving construction laborers accounted for more than one out of every four
private construction fatalities in both 2005 and 2006.
SOURCE: U.S. Bureau of Labor Statistics, U.S. Department of Labor, 2008