Page 102 - Using ANSYS for Finite Element Analysis Dynamic, Probabilistic, Design and Heat Transfer Analysis
P. 102

probabilistic Design analysis   •   89
                          where g is the shape parameter, m is the location parameter, and a is
                      the scale parameter. The case where m = 0 and a = 1 is called the standard
                      lognormal distribution. The case where m = 0 and a = 1 is called the
                      2-parameter Weibull distribution. The equation for the standard Weibull
                      distribution reduces to:

                                     fx () = () (g − ) 1  exp − ( ) ≥ 0; g > 0
                                                        g
                                           g
                                                       xx
                                             x

                                  Weibull  PDF (g = 0.5)      Weibull  PDF (g = 1)
                           1                          0.6
                                                      0.8
                          Probability  0.5           Probability  0.4
                                                      0.2
                           0                           0
                            0   1    2   3    4   5    0    1   2    3   4    5
                                       x                           x
                                  Weibull  PDF (g = 2)        Weibull  PDF (g = 5)
                          0.8                          1
                          0.6
                          Probability  0.4           Probability  0.5
                          0.2
                           0                           0
                            0   1    2   3    4   5    0    1   2    3   4    5
                                       x                           x
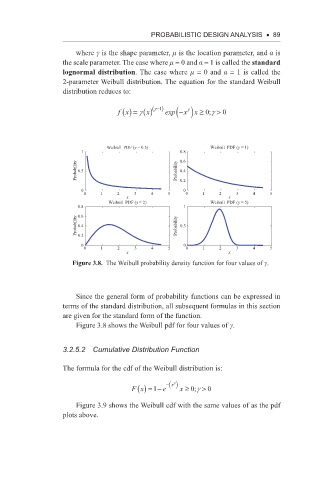
                         Figure 3.8.  The Weibull probability density function for four values of g.


                          Since the general form of probability functions can be expressed in
                      terms of the standard distribution, all subsequent formulas in this section
                      are given for the standard form of the function.
                          Figure 3.8 shows the Weibull pdf for four values of g.


                      3.2.5.2  Cumulative Distribution Function

                      The formula for the cdf of the Weibull distribution is:

                                                    g
                                         Fx () =− e −  x ( )  x ≥ 0 g > 0
                                                          ;
                                              1
                          Figure 3.9 shows the Weibull cdf with the same values of as the pdf
                      plots above.
   97   98   99   100   101   102   103   104   105   106   107