
Page 105 - Using ANSYS for Finite Element Analysis Dynamic, Probabilistic, Design and Heat Transfer Analysis
P. 105
92 • using ansys for finite eLement anaLysis
3.3.2 MeAn VALUeS, STAnDARD DeViATion, exCeeDenCe
VALUeS
The mean value and the standard deviation are most commonly used to
describe the scatter of data. Frequently, information about a physical quan-
tity is given in the form that its value is; for example, “100±5.5.” Often, but
not always, this form means that the value “100” is the mean value and “5.5”
is the standard deviation. To specify data in this form implies a Gaussian
distribution, but you must verify this (a mean value and standard deviation
can be provided for any collection of data regardless of the true distribution
type). If you have more information (e.g., you know that the data must be
lognormal distributed), then the PDS allows you to use the mean value and
standard deviation for a definition of a lognormal distribution.
Sometimes the scatter of data is also specified by a mean value and an
exceedence confidence limit. The yield strength of a material is sometimes given
in this way; for example, a 99 percent exceedence limit based on a 95 percent
confidence level is provided. This means that derived from the measured data
we can be sure by 95 percent that in 99 percent of all cases the property values
will exceed the specified limit and only in 1 percent of all cases they will drop
below the specified limit. The supplier of this information is using mean value,
the standard deviation, and the number of samples of the measured data to derive
this kind of information. If the scatter of the data is provided in this way, the best
way to pursue this further is to ask for more details from the data supplier. Since
the given exceedence limit is based on the measured data and its statistical assess-
ment, the supplier might be able to provide you with the details that were used.
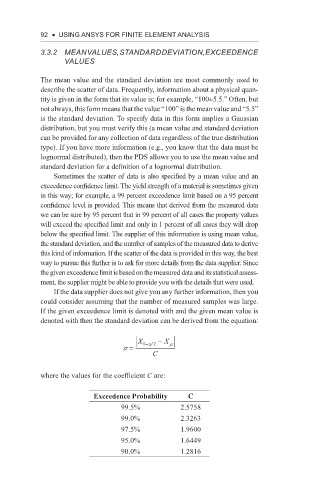
If the data supplier does not give you any further information, then you
could consider assuming that the number of measured samples was large.
If the given exceedence limit is denoted with and the given mean value is
denoted with then the standard deviation can be derived from the equation:
X − X
/
s = 1 − a 2 m
C
where the values for the coefficient C are:
Exceedence Probability C
99.5% 2.5758
99.0% 2.3263
97.5% 1.9600
95.0% 1.6449
90.0% 1.2816