
Page 37 - Using ANSYS for Finite Element Analysis Dynamic, Probabilistic, Design and Heat Transfer Analysis
P. 37
24 • using ansys for finite eLement anaLysis
also given to indicate the spread of properties associated with different
alloys, for example.
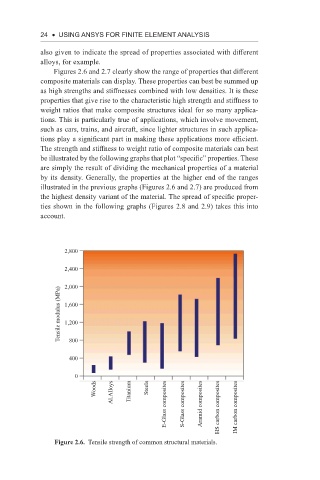
Figures 2.6 and 2.7 clearly show the range of properties that different
composite materials can display. These properties can best be summed up
as high strengths and stiffnesses combined with low densities. It is these
properties that give rise to the characteristic high strength and stiffness to
weight ratios that make composite structures ideal for so many applica-
tions. This is particularly true of applications, which involve movement,
such as cars, trains, and aircraft, since lighter structures in such applica-
tions play a significant part in making these applications more efficient.
The strength and stiffness to weight ratio of composite materials can best
be illustrated by the following graphs that plot “specific” properties. These
are simply the result of dividing the mechanical properties of a material
by its density. Generally, the properties at the higher end of the ranges
illustrated in the previous graphs (Figures 2.6 and 2.7) are produced from
the highest density variant of the material. The spread of specific proper-
ties shown in the following graphs (Figures 2.8 and 2.9) takes this into
account.
2,800
2,400
2,000
Tensile modulus (MPa) 1,600
1,200
800
400
0
Woods Al.Alloys Titanium Steels E-Glass composites S-Glass composites Aramid composites HS carbon composites IM carbon composites
Figure 2.6. Tensile strength of common structural materials.