
Page 124 - Using ANSYS for Finite Element Analysis A Tutorial for Engineers
P. 124
stAtIc AnAlysIs usIng lIne elements • 111
Because you changed the contour intervals for the Displacement plot
to User Specified, you need to switch this back to Auto calculated to
obtain new values for VMIN/VMAX.
Utility Menu > PlotCtrls > Style > Contours > Uniform Contours ...
Again, you may wish to select more appropriate intervals for the con-
tour plot.
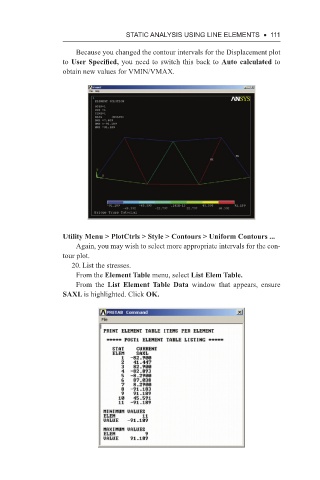
20. List the stresses.
From the Element Table menu, select List Elem Table.
From the List Element Table Data window that appears, ensure
SAXL is highlighted. Click OK.