
Page 215 -
P. 215
Chapter 5 Database Processing
214
100
200
Jones
300
Accounting Wu
400
Smith
500
Finance Lopez
600
Department Entities
Greene
700
Adviser Entities
Figure 5-19
Example of Department, Adviser, 800
and Student Entities and Student Entities
Relationships
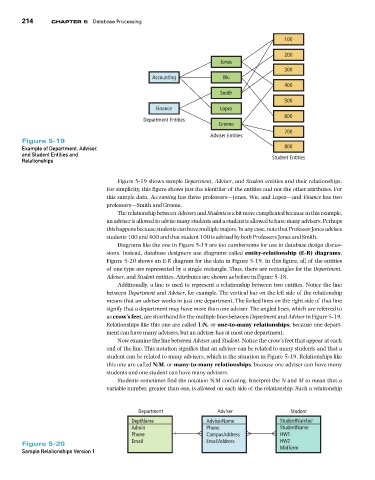
Figure 5-19 shows sample Department, Adviser, and Student entities and their relationships.
For simplicity, this figure shows just the identifier of the entities and not the other attributes. For
this sample data, Accounting has three professors—Jones, Wu, and Lopez—and Finance has two
professors—Smith and Greene.
The relationship between Advisers and Students is a bit more complicated because in this example,
an adviser is allowed to advise many students and a student is allowed to have many advisers. Perhaps
this happens because students can have multiple majors. In any case, note that Professor Jones advises
students 100 and 400 and that student 100 is advised by both Professors Jones and Smith.
Diagrams like the one in Figure 5-19 are too cumbersome for use in database design discus-
sions. Instead, database designers use diagrams called entity-relationship (E-R) diagrams.
Figure 5-20 shows an E-R diagram for the data in Figure 5-19. In this figure, all of the entities
of one type are represented by a single rectangle. Thus, there are rectangles for the Department,
Adviser, and Student entities. Attributes are shown as before in Figure 5-18.
Additionally, a line is used to represent a relationship between two entities. Notice the line
between Department and Adviser, for example. The vertical bar on the left side of the relationship
means that an adviser works in just one department. The forked lines on the right side of that line
signify that a department may have more than one adviser. The angled lines, which are referred to
as crow’s feet, are shorthand for the multiple lines between Department and Adviser in Figure 5-19.
Relationships like this one are called 1:N, or one-to-many relationships, because one depart-
ment can have many advisers, but an adviser has at most one department.
Now examine the line between Adviser and Student. Notice the crow’s feet that appear at each
end of the line. This notation signifies that an adviser can be related to many students and that a
student can be related to many advisers, which is the situation in Figure 5-19. Relationships like
this one are called N:M, or many-to-many relationships, because one adviser can have many
students and one student can have many advisers.
Students sometimes find the notation N:M confusing. Interpret the N and M to mean that a
variable number, greater than one, is allowed on each side of the relationship. Such a relationship
Department Adviser Student
DeptName AdviserName StudentNumber
Admin Phone StudentName
Phone CampusAddress HW1
Figure 5-20 Email EmailAddress HW2
Sample Relationships Version 1 MidTerm