
Page 205 - Valve Selection Handbook
P. 205
192 Valve Selection Handbook
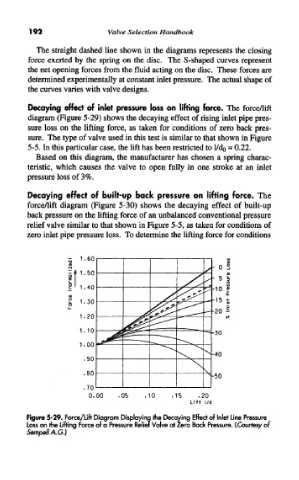
The straight dashed line shown in the diagrams represents the closing
force exerted by the spring on the disc. The S-shaped curves represent
the net opening forces from the fluid acting on the disc. These forces are
determined experimentally at constant inlet pressure. The actual shape of
the curves varies with valve designs.
Decaying effect of inlet pressure loss on lifting force. The force/lift
diagram (Figure 5-29) shows the decaying effect of rising inlet pipe pres-
sure loss on the lifting force, as taken for conditions of zero back pres-
sure. The type of valve used in this test is similar to that shown in Figure
5-5. In this particular case, the lift has been restricted to l/d 0 = 0.22.
Based on this diagram, the manufacturer has chosen a spring charac-
teristic, which causes the valve to open fully in one stroke at an inlet
pressure loss of 3%.
Decaying effect of built-up back pressure on lifting force. The
force/lift diagram (Figure 5-30) shows the decaying effect of built-up
back pressure on the lifting force of an unbalanced conventional pressure
relief valve similar to that shown in Figure 5-5, as taken for conditions of
zero inlet pipe pressure loss. To determine the lifting force for conditions
Figure 5-29. Force/Lift Diagram Displaying the Decaying Effect of Inlet Line Pressure
Loss on the Lifting Force of a Pressure Relief Valve at Zero Back Pressure. (Courtesy of
Sempell A.G.]