
Page 158 - Vibrational Spectroscopic Imaging for Biomedical Applications
P. 158
134 Cha pte r F i v e
8
Major differences have been found as hyphae mature; differences
between strains and species may be identified and interpreted in
51
terms of cell morphology and physiology. Since the spatial resolu-
tion achievable with sFTIR is typically an order of magnitude poorer
than that of Raman, and since the information turns out to be quite
different also, we deal with the each separately.
5.4.1 Physical Considerations and Spectral
Anomalies in sFTIR Spectra
The walls of fungal hyphae are composed primarily of cross-linked sug-
ars; the hyphae may be hundreds of micrometers in length, but are typi-
cally only a few micrometers in diameter. Hence, their physical structure
presents some challenges for FTIR imaging. We have acquired all our
fungal FTIR spectra described here with synchrotron-source IR light, on
instruments setup for single pixel or raster scanning.
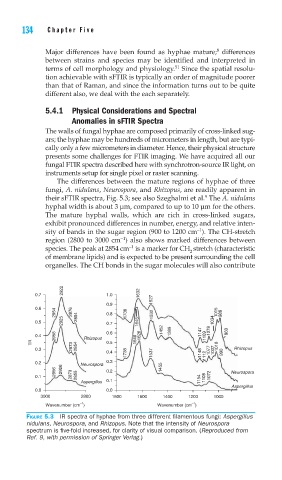
The differences between the mature regions of hyphae of three
fungi, A. nidulans, Neurospora, and Rhizopus, are readily apparent in
9
their sFTIR spectra, Fig. 5.3; see also Szeghalmi et al. The A. nidulans
hyphal width is about 3 μm, compared to up to 10 μm for the others.
The mature hyphal walls, which are rich in cross-linked sugars,
exhibit pronounced differences in number, energy, and relative inten-
–1
sity of bands in the sugar region (900 to 1200 cm ). The CH-stretch
−1
region (2800 to 3000 cm ) also shows marked differences between
−1
species. The peak at 2854 cm is a marker for CH stretch (characteristic
2
of membrane lipids) and is expected to be present surrounding the cell
organelles. The CH bonds in the sugar molecules will also contribute
2922
0.7 1.0 1632
0.9 1527
0.6
2954 2876 2854 0.8 1738 1532 1015 988
0.5 2925 0.7 1645 1034
0.4 2958 Rhizopus 0.6 1626 1452 1389 1147 1109 1078 963
TR 0.5 1648
0.3 2873 2854 0.4 1738 1537 1148 1112 1077 1037 1018 990 Rhizopus
0.2 Neurospora 0.3 1455
2956 2926 0.2 Neurospora
0.1 2873 2855 1154 1108 1072
Aspergillus 0.1
Aspergillus
0.0 0.0
3000 2800 1800 1600 1400 1200 1000
–1 –1
Wavenumber (cm ) Wavenumber (cm )
FIGURE 5.3 IR spectra of hyphae from three different fi lamentous fungi: Aspergillus
nidulans, Neurospora, and Rhizopus. Note that the intensity of Neurospora
spectrum is fi ve-fold increased, for clarity of visual comparison. (Reproduced from
Ref. 9, with permission of Springer Verlag.)