
Page 163 - Vibrational Spectroscopic Imaging for Biomedical Applications
P. 163
sFTIR, Raman, and SERS Imaging of Fungal Cells 139
5.5.1 Raman Map from a Hypha, at Growing Tip
Raman maps acquired with the fast acquisition rates now possible
permit imaging of fungi in a matter of only a few minutes, for strong
spectral features. Where more spectral information is desired, slower
scanning can always be chosen to improve the signal to noise. Such
maps provide information on the hyphae directly, in the same manner
51
as the sFTIR maps. Different vibrational modes are more prominent,
thus complementary information can be obtained.
We have deleted the single-copy UGM sequence (AN3112.4,
which we call ugmA) from an A. nidulans nkuAΔ strain, creating
11
ugmAΔ. UgmA catalyzes the conversion between uridine diphos-
phogalactopyranose (UDP-Galp) and uridine diphosphogalactofura-
nose (UDP-Galf) in the fungal cell wall. The ugmA gene is nonessential
in A. nidulans, but the genetic knockout strongly delays asexual spor-
ulation (conidiation) and significantly alters both colony and hyphal
morphology. The latter are broader, shorter, and branch more fre-
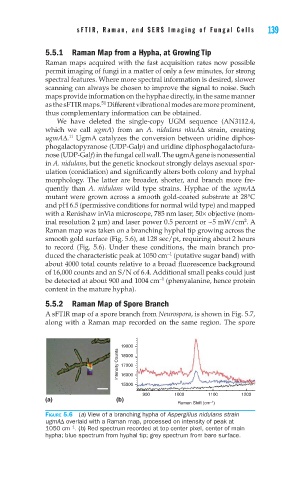
quently than A. nidulans wild type strains. Hyphae of the ugmAΔ
mutant were grown across a smooth gold-coated substrate at 28°C
and pH 6.5 (permissive conditions for normal wild type) and mapped
with a Renishaw inVia microscope, 785 nm laser, 50× objective (nom-
2
inal resolution 2 μm) and laser power 0.5 percent or ~5 mW/cm . A
Raman map was taken on a branching hyphal tip growing across the
smooth gold surface (Fig. 5.6), at 128 sec/pt, requiring about 2 hours
to record (Fig. 5.6). Under these conditions, the main branch pro-
−1
duced the characteristic peak at 1050 cm (putative sugar band) with
about 4000 total counts relative to a broad fluorescence background
of 16,000 counts and an S/N of 6.4. Additional small peaks could just
−1
be detected at about 900 and 1004 cm (phenyalanine, hence protein
content in the mature hypha).
5.5.2 Raman Map of Spore Branch
A sFTIR map of a spore branch from Neurospora, is shown in Fig. 5.7,
along with a Raman map recorded on the same region. The spore
19000
Intensity Counts 18000
17000
16000
15000
900 1000 1100 1200
(a) (b)
Raman Shift (cm –1 )
FIGURE 5.6 (a) View of a branching hypha of Aspergillus nidulans strain
ugmAΔ overlaid with a Raman map, processed on intensity of peak at
−1
1050 cm . (b) Red spectrum recorded at top center pixel, center of main
hypha; blue spectrum from hyphal tip; grey spectrum from bare surface.