
Page 165 - Vibrational Spectroscopic Imaging for Biomedical Applications
P. 165
sFTIR, Raman, and SERS Imaging of Fungal Cells 141
1.3
1.2
1.1
1.0
0.9
0.8
TR 0.7
0.6
0.5
0.4
0.3
0.2
0.1
1800 1600 1400 1200 1000
–1
Wavenumbers (cm )
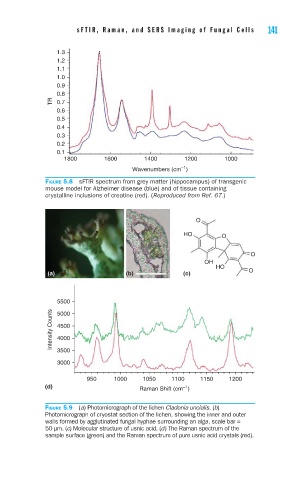
FIGURE 5.8 sFTIR spectrum from grey matter (hippocampus) of transgenic
mouse model for Alzheimer disease (blue) and of tissue containing
crystalline inclusions of creatine (red). (Reproduced from Ref. 67.)
O
HO O
O
OH
HO
(a) (b) (c) O
5500
Intensity Counts 4500
5000
4000
3500
3000
950 1000 1050 1100 1150 1200
(d) Raman Shift (cm )
–1
FIGURE 5.9 (a) Photomicrograph of the lichen Cladonia uncialis. (b)
Photomicrograph of cryostat section of the lichen, showing the inner and outer
walls formed by agglutinated fungal hyphae surrounding an alga, scale bar =
50 μm. (c) Molecular structure of usnic acid. (d) The Raman spectrum of the
sample surface (green) and the Raman spectrum of pure usnic acid crystals (red).