
Page 160 - Vibrational Spectroscopic Imaging for Biomedical Applications
P. 160
136 Cha pte r F i v e
1.2
0.2 1.0
50 μm 1073 1054 1026
0.8 1006 42°C
(a) 0.15 Tip 1150 1104
0.6
TR
0.1
0.4 1071 1048 1024
50 μm 1151 1103 994
0.05 28°C
0.2
Tip
(b) (c) 0.0 0.0
1800 1600 1400 1200 1000 800
–1
Wavenumber (cm )
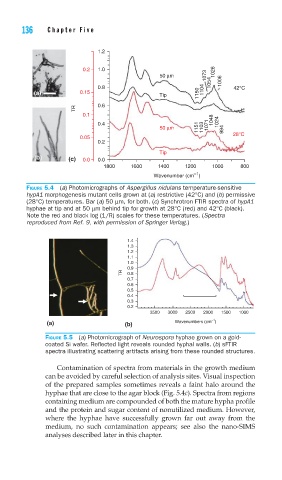
FIGURE 5.4 (a) Photomicrographs of Aspergillus nidulans temperature-sensitive
hypA1 morphogenesis mutant cells grown at (a) restrictive (42°C) and (b) permissive
(28°C) temperatures. Bar (a) 50 μm, for both. (c) Synchrotron FTIR spectra of hypA1
hyphae at tip and at 50 μm behind tip for growth at 28°C (red) and 42°C (black).
Note the red and black log (1/R) scales for these temperatures. (Spectra
reproduced from Ref. 9, with permission of Springer Verlag.)
1.4
1.3
1.2
1.1
1.0
0.9
TR 0.8
0.7
0.6
0.5
0.4
0.3
0.2
3500 3000 2500 2000 1500 1000
–1
(a) (b) Wavenumbers (cm )
FIGURE 5.5 (a) Photomicrograph of Neurospora hyphae grown on a gold-
coated Si wafer. Refl ected light reveals rounded hyphal walls. (b) sFTIR
spectra illustrating scattering artifacts arising from these rounded structures.
Contamination of spectra from materials in the growth medium
can be avoided by careful selection of analysis sites. Visual inspection
of the prepared samples sometimes reveals a faint halo around the
hyphae that are close to the agar block (Fig. 5.4c). Spectra from regions
containing medium are compounded of both the mature hypha profile
and the protein and sugar content of nonutilized medium. However,
where the hyphae have successfully grown far out away from the
medium, no such contamination appears; see also the nano-SIMS
analyses described later in this chapter.