
Page 293 - Vibrational Spectroscopic Imaging for Biomedical Applications
P. 293
268 Cha pte r Ni ne
Virtual
Energy States
Rayleigh
Scattering
Stokes
Raman Anti-Stokes
Excitation Scattering Raman
Energy Scattering
4
3
Vibrational
2 Energy
IR 1 States
Absorbance
0
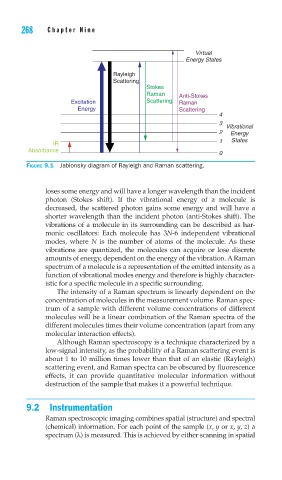
FIGURE 9.1 Jablonsky diagram of Rayleigh and Raman scattering.
loses some energy and will have a longer wavelength than the incident
photon (Stokes shift). If the vibrational energy of a molecule is
decreased, the scattered photon gains some energy and will have a
shorter wavelength than the incident photon (anti-Stokes shift). The
vibrations of a molecule in its surrounding can be described as har-
monic oscillators: Each molecule has 3N-6 independent vibrational
modes, where N is the number of atoms of the molecule. As these
vibrations are quantized, the molecules can acquire or lose discrete
amounts of energy, dependent on the energy of the vibration. A Raman
spectrum of a molecule is a representation of the emitted intensity as a
function of vibrational modes energy and therefore is highly character-
istic for a specific molecule in a specific surrounding.
The intensity of a Raman spectrum is linearly dependent on the
concentration of molecules in the measurement volume. Raman spec-
trum of a sample with different volume concentrations of different
molecules will be a linear combination of the Raman spectra of the
different molecules times their volume concentration (apart from any
molecular interaction effects).
Although Raman spectroscopy is a technique characterized by a
low-signal intensity, as the probability of a Raman scattering event is
about 1 to 10 million times lower than that of an elastic (Rayleigh)
scattering event, and Raman spectra can be obscured by fluorescence
effects, it can provide quantitative molecular information without
destruction of the sample that makes it a powerful technique.
9.2 Instrumentation
Raman spectroscopic imaging combines spatial (structure) and spectral
(chemical) information. For each point of the sample (x, y or x, y, z) a
spectrum (λ) is measured. This is achieved by either scanning in spatial