
Page 22 - Visions of the Future Chemistry and Life Science
P. 22
12 G. ROBERTS
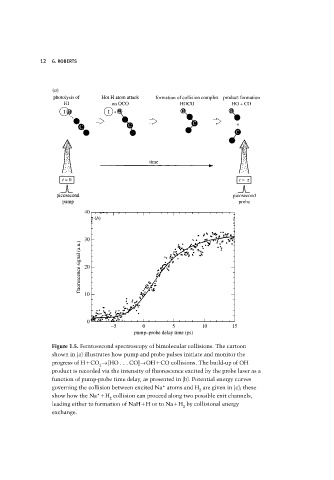
Figure 1.5. Femtosecond spectroscopy of bimolecular collisions. The cartoon
shown in (a) illustrates how pump and probe pulses initiate and monitor the
progress of H CO →[HO . . . CO]→OH CO collisions. The build-up of OH
2
product is recorded via the intensity of fluorescence excited by the probe laser as a
function of pump-probe time delay, as presented in (b). Potential energy curves
governing the collision between excited Na* atoms and H are given in (c); these
2
show how the Na* H collision can proceed along two possible exit channels,
2
leading either to formation of NaH H or to Na H by collisional energy
2
exchange.