
Page 40 - Visions of the Future Chemistry and Life Science
P. 40
Enzymology takes a quantum leap forward 29
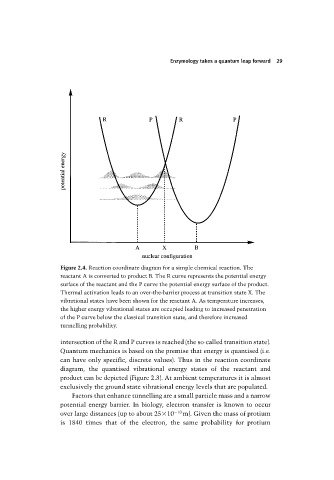
Figure 2.4. Reaction coordinate diagram for a simple chemical reaction. The
reactant A is converted to product B. The R curve represents the potential energy
surface of the reactant and the P curve the potential energy surface of the product.
Thermal activation leads to an over-the-barrier process at transition state X. The
vibrational states have been shown for the reactant A. As temperature increases,
the higher energy vibrational states are occupied leading to increased penetration
of the P curve below the classical transition state, and therefore increased
tunnelling probability.
intersection of the R and P curves is reached (the so-called transition state).
Quantum mechanics is based on the premise that energy is quantised (i.e.
can have only specific, discrete values). Thus in the reaction coordinate
diagram, the quantised vibrational energy states of the reactant and
product can be depicted (Figure 2.3). At ambient temperatures it is almost
exclusively the ground state vibrational energy levels that are populated.
Factors that enhance tunnelling are a small particle mass and a narrow
potential energy barrier. In biology, electron transfer is known to occur
over large distances (up to about 25 10 10 m). Given the mass of protium
is 1840 times that of the electron, the same probability for protium