
Page 158 - Materials Chemistry, Second Edition
P. 158
CAT3525_C06.qxd 1/29/2005 9:56 AM Page 129
Recycling Solid Wastes 129
Resource recovery — Extraction of energy or materials from wastes. This term incorporates all
of the above. Thus, a waste-to-energy facility will incinerate organic wastes to generate heat energy.
Glass and rubber are separated from wastes, processed, and used as road building materials.
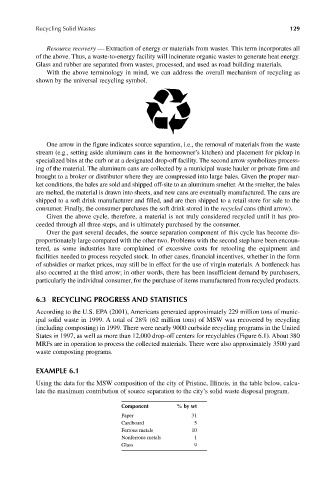
With the above terminology in mind, we can address the overall mechanism of recycling as
shown by the universal recycling symbol.
One arrow in the figure indicates source separation, i.e., the removal of materials from the waste
stream (e.g., setting aside aluminum cans in the homeowner’s kitchen) and placement for pickup in
specialized bins at the curb or at a designated drop-off facility. The second arrow symbolizes process-
ing of the material. The aluminum cans are collected by a municipal waste hauler or private firm and
brought to a broker or distributor where they are compressed into large bales. Given the proper mar-
ket conditions, the bales are sold and shipped off-site to an aluminum smelter. At the smelter, the bales
are melted, the material is drawn into sheets, and new cans are eventually manufactured. The cans are
shipped to a soft drink manufacturer and filled, and are then shipped to a retail store for sale to the
consumer. Finally, the consumer purchases the soft drink stored in the recycled cans (third arrow).
Given the above cycle, therefore, a material is not truly considered recycled until it has pro-
ceeded through all three steps, and is ultimately purchased by the consumer.
Over the past several decades, the source separation component of this cycle has become dis-
proportionately large compared with the other two. Problems with the second step have been encoun-
tered, as some industries have complained of excessive costs for retooling the equipment and
facilities needed to process recycled stock. In other cases, financial incentives, whether in the form
of subsidies or market prices, may still be in effect for the use of virgin materials. A bottleneck has
also occurred at the third arrow; in other words, there has been insufficient demand by purchasers,
particularly the individual consumer, for the purchase of items manufactured from recycled products.
6.3 RECYCLING PROGRESS AND STATISTICS
According to the U.S. EPA (2001), Americans generated approximately 229 million tons of munic-
ipal solid waste in 1999. A total of 28% (62 million tons) of MSW was recovered by recycling
(including composting) in 1999. There were nearly 9000 curbside recycling programs in the United
States in 1997, as well as more than 12,000 drop-off centers for recyclables (Figure 6.1). About 380
MRFs are in operation to process the collected materials. There were also approximately 3500 yard
waste composting programs.
EXAMPLE 6.1
Using the data for the MSW composition of the city of Pristine, Illinois, in the table below, calcu-
late the maximum contribution of source separation to the city’s solid waste disposal program.
Component % by wt
Paper 31
Cardboard 5
Ferrous metals 10
Nonferrous metals 1
Glass 9