
Page 162 - Materials Chemistry, Second Edition
P. 162
CAT3525_C06.qxd 1/29/2005 9:56 AM Page 133
Recycling Solid Wastes 133
6.7.2 PAPER RECYCLING
Paper recycling has a long history. Collection drives by the Boy Scouts and other organizations were
in place before World War II. Such programs increased greatly during the war.
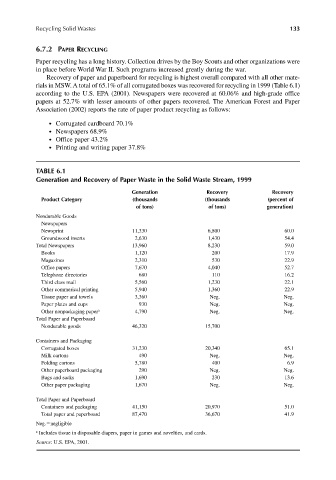
Recovery of paper and paperboard for recycling is highest overall compared with all other mate-
rials in MSW. A total of 65.1% of all corrugated boxes was recovered for recycling in 1999 (Table 6.1)
according to the U.S. EPA (2001). Newspapers were recovered at 60.06% and high-grade office
papers at 52.7% with lesser amounts of other papers recovered. The American Forest and Paper
Association (2002) reports the rate of paper product recycling as follows:
● Corrugated cardboard 70.1%
● Newspapers 68.9%
● Office paper 43.2%
● Printing and writing paper 37.8%
TABLE 6.1
Generation and Recovery of Paper Waste in the Solid Waste Stream, 1999
Generation Recovery Recovery
Product Category (thousands (thousands (percent of
of tons) of tons) generation)
Nondurable Goods
Newspapers
Newsprint 11,330 6,800 60.0
Groundwood inserts 2,630 1,430 54.4
Total Newspapers 13,960 8,230 59.0
Books 1,120 200 17.9
Magazines 2,310 530 22.9
Office papers 7,670 4,040 52.7
Telephone directories 680 110 16.2
Third class mail 5,560 1,230 22.1
Other commerical printing 5,940 1,360 22.9
Tissue paper and towels 3,360 Neg. Neg.
Paper plates and cups 930 Neg. Neg.
Other nonpackaging paper a 4,790 Neg. Neg.
Total Paper and Paperboard
Nondurable goods 46,320 15,700
Containers and Packaging
Corrugated boxes 31,230 20,340 65.1
Milk cartons 490 Neg. Neg.
Folding cartons 5,780 400 6.9
Other paperboard packaging 290 Neg. Neg.
Bags and sacks 1,690 230 13.6
Other paper packaging 1,670 Neg. Neg.
Total Paper and Paperboard
Containers and packaging 41,150 20,970 51.0
Total paper and paperboard 87,470 36,670 41.9
Neg. negligible
a Includes tissue in disposable diapers, paper in games and novelties, and cards.
Source: U.S. EPA, 2001.