
Page 166 - Materials Chemistry, Second Edition
P. 166
CAT3525_C06.qxd 1/29/2005 9:56 AM Page 137
Recycling Solid Wastes 137
The molten glass is pressed into molds that form bottles and jars. Air is injected into the con-
tainers to form the openings within. Cooling in an annealing oven strengthens the new bottles and
jars. The cooled product is checked for flaws such as bubbles before shipment. The final step is fill-
ing with food, nonfood (medicines, perfume, cosmetics, and cleaning supplies), and other consumer
and industrial items.
6.8.2 GLASS RECYCLING
Glass has experienced a more rapid growth in recycling than that of any other commodity except
aluminum beverage containers. In recent years the use of recycled glass has increased more than
80% with glass manufacturers melting more than 2.5 million tons in their furnaces in a single year.
This growth is the result of both increased collection through curbside recycling programs and
accelerated demand from glass manufacturers (CMI, 2002).
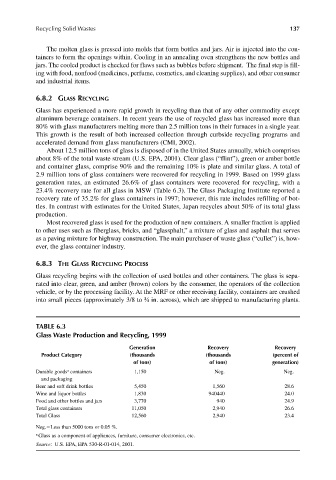
About 12.5 million tons of glass is disposed of in the United States annually, which comprises
about 8% of the total waste stream (U.S. EPA, 2001). Clear glass (“flint”), green or amber bottle
and container glass, comprise 90% and the remaining 10% is plate and similar glass. A total of
2.9 million tons of glass containers were recovered for recycling in 1999. Based on 1999 glass
generation rates, an estimated 26.6% of glass containers were recovered for recycling, with a
23.4% recovery rate for all glass in MSW (Table 6.3). The Glass Packaging Institute reported a
recovery rate of 35.2% for glass containers in 1997; however, this rate includes refilling of bot-
tles. In contrast with estimates for the United States, Japan recycles about 50% of its total glass
production.
Most recovered glass is used for the production of new containers. A smaller fraction is applied
to other uses such as fiberglass, bricks, and “glassphalt,” a mixture of glass and asphalt that serves
as a paving mixture for highway construction. The main purchaser of waste glass (“cullet”) is, how-
ever, the glass container industry.
6.8.3 THE GLASS RECYCLING PROCESS
Glass recycling begins with the collection of used bottles and other containers. The glass is sepa-
rated into clear, green, and amber (brown) colors by the consumer, the operators of the collection
vehicle, or by the processing facility. At the MRF or other receiving facility, containers are crushed
into small pieces (approximately 3/8 to ¾ in. across), which are shipped to manufacturing plants.
TABLE 6.3
Glass Waste Production and Recycling, 1999
Generation Recovery Recovery
Product Category (thousands (thousands (percent of
of tons) of tons) generation)
a
Durable goods containers 1,150 Neg. Neg.
and packaging
Beer and soft drink bottles 5,450 1,560 28.6
Wine and liquor bottles 1,830 940440 24.0
Food and other bottles and jars 3,770 940 24.9
Total glass containers 11,050 2,940 26.6
Total Glass 12,560 2,940 23.4
Neg. Less than 5000 tons or 0.05 %.
a Glass as a component of appliances, furniture, consumer electronics, etc.
Source: U.S. EPA, EPA 530-R-01-014, 2001.