
Page 421 - Materials Chemistry, Second Edition
P. 421
CAT3525_C12.qxd 1/27/2005 4:11 PM Page 392
392 Waste Management Practices: Municipal, Hazardous, and Industrial
12.3 GENERATOR TYPES
12.3.1 THE LARGE QUANTITY GENERATOR
Facilities that generate more than 1000 kg (2204 lb) of hazardous waste per calendar month or more
than 1 kg of acutely hazardous waste per month, are designated large quantity generators (LQGs). In
1999, a total of 20,083 LQGs reported that they generated 40 million tons of RCRA hazardous waste
(U.S. EPA, 2001a). A comparison of the 1997 data with the 1999 data shows that the number of LQGs
decreased by 233 and the quantity of hazardous waste generated decreased by 650,000 tons or 1.5%.
The five states that contributed most to the national hazardous waste generation total in 1999
were Texas (14.9 million tons), Louisiana (4.4 million tons), Illinois (2.9 million tons), Tennessee
(2.2 million tons), and Ohio (1.6 million tons). The LQGs in these states accounted for 65% of the
national total quantity generated. Fourteen of the top 50 generators are located in Texas, the top-
ranked state in hazardous waste generation. These 14 LQGs accounted for 92% of the state’s gen-
eration total and 34% of the national generation total. The six LQGs in Louisiana, the state ranked
second in hazardous waste generation, accounted for 92% of the state’s generation total and 10%
of the national generation total. Ten of the largest generators are located in Illinois, Tennessee, and
Ohio, the states ranked third, fourth, and fifth, respectively, in hazardous waste generation. These
LQGs accounted for 12% of the national total quantity generated (U.S. EPA, 2001a).
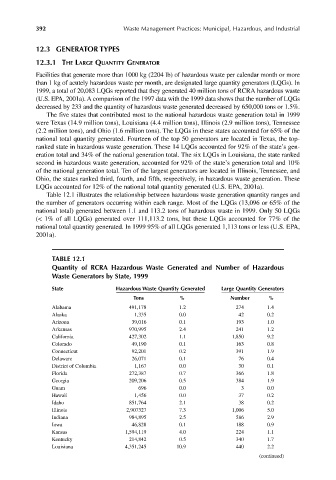
Table 12.1 illustrates the relationship between hazardous waste generation quantity ranges and
the number of generators occurring within each range. Most of the LQGs (13,096 or 65% of the
national total) generated between 1.1 and 113.2 tons of hazardous waste in 1999. Only 50 LQGs
(< 1% of all LQGs) generated over 111,113.2 tons, but these LQGs accounted for 77% of the
national total quantity generated. In 1999 95% of all LQGs generated 1,113 tons or less (U.S. EPA,
2001a).
TABLE 12.1
Quantity of RCRA Hazardous Waste Generated and Number of Hazardous
Waste Generators by State, 1999
State Hazardous Waste Quantity Generated Large Quantity Generators
Tons % Number %
Alabama 491,178 1.2 274 1.4
Alaska 1,335 0.0 42 0.2
Arizona 39,016 0.1 193 1.0
Arkansas 970,995 2.4 241 1.2
California 427,302 1.1 1,850 9.2
Colorado 49,190 0.1 163 0.8
Connecticut 92,201 0.2 391 1.9
Delaware 26,071 0.1 76 0.4
District of Columbia 1,167 0.0 30 0.1
Florida 272,387 0.7 366 1.8
Georgia 209,206 0.5 384 1.9
Guam 696 0.0 3 0.0
Hawaii 1,456 0.0 37 0.2
Idaho 851,764 2.1 38 0.2
Illinois 2,907327 7.3 1,006 5.0
Indiana 984,895 2.5 586 2.9
Iowa 46,828 0.1 188 0.9
Kansas 1,594,119 4.0 224 1.1
Kentucky 214,842 0.5 340 1.7
Louisiana 4,351,245 10.9 440 2.2
(continued)